- Litecoin price declined towards the $65.00 level before buyers appeared against the US Dollar.
- LTC price started a decent upward move and recovered above the $68.20 and $70.20 resistances.
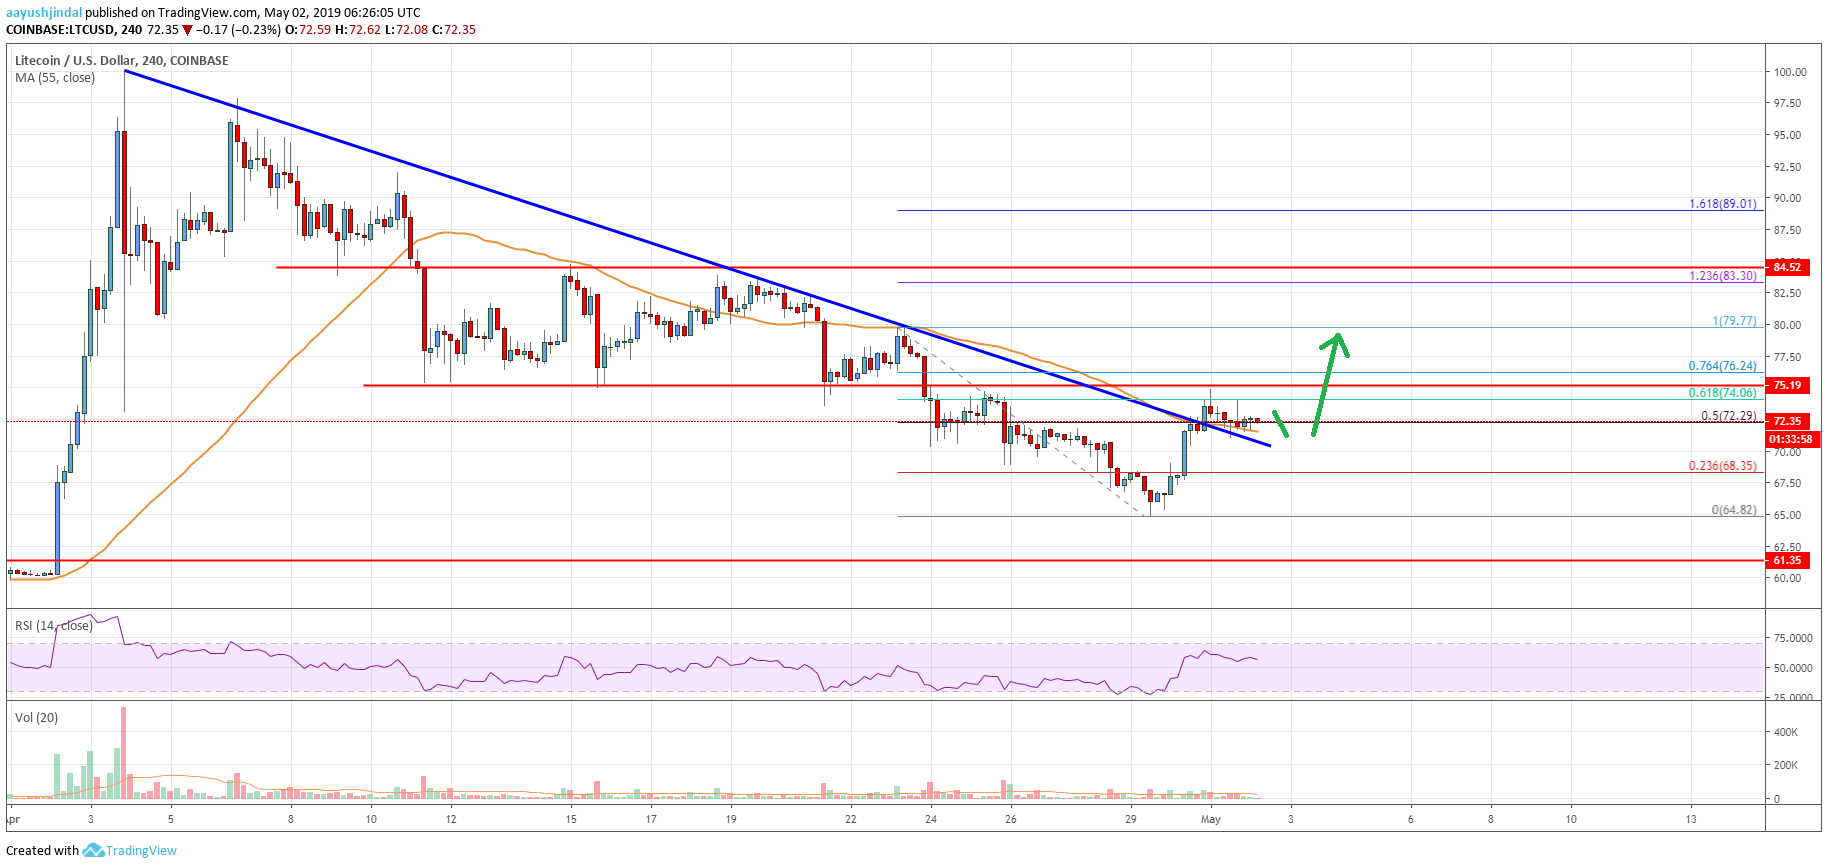
- There was a break above a key bearish trend line with resistance at $72.35 on the 4-hours chart of the LTC/USD pair (data feed from Coinbase).
- The pair is likely to climb further above the $73.00 and $75.00 resistances in the near term.
Litecoin price is slowly gaining bullish momentum against the US Dollar and bitcoin. LTC price remains well bid and it could start a strong upward move above the $75.00 resistance.
Litecoin Price Analysis
This past week, there was a downside extension in litecoin price below the $75.00 support against the US Dollar. The LTC/USD pair even broke the $68.20 support and 55 simple moving average (4-hours). As a result, there was a downside extension and the price traded as low as $64.82. Finally, the bulls took a stand and the price recovered above the $68.20 and $69.50 levels. More importantly, there was a proper close above $70.00 and the 55 simple moving average (4-hours).
The price surpassed the 50% Fib retracement level of the last decline from the $79.78 high to $64.82 low. Besides, there was a break above a key bearish trend line with resistance at $72.35 on the 4-hours chart of the LTC/USD pair. There was a spike towards the $75.00 level, where sellers emerged. It seems like the 61.8% Fib retracement level of the last decline from the $79.78 high to $64.82 low is acting as a resistance. At the moment, the price is currently consolidating above $71.00 and the 55 SMA. As long as the price is above $70.00, it is likely to resume its upward move.
On the upside, a successful close above $75.00 and $75.20 may push the price higher. Therefore, the next stop for the bulls could be near the $79.77 swing high. Above $80.00, the price may test the $83.30 level. It represents the 1.236 Fib extension level of the last decline from the $79.78 high to $64.82 low.

Looking at the chart, litecoin price clearly moved into a positive zone, with a close above $70.50 and the 55 SMA. As long as there is no close below $70.00, the price is likely to rebound further. The main hurdles for the bulls are $75.00, $75.20, and followed by $76.25.
Technical indicators
4 hours MACD – The MACD for LTC/USD is losing momentum in the bullish zone, with a few negative signs.
4 hours RSI (Relative Strength Index) – The RSI for LTC/USD is currently moving lower towards the 50 level.
Key Support Levels – $70.50 and $70.00.
Key Resistance Levels – $75.20 and $76.25.


Leave a Reply
You must be logged in to post a comment.