

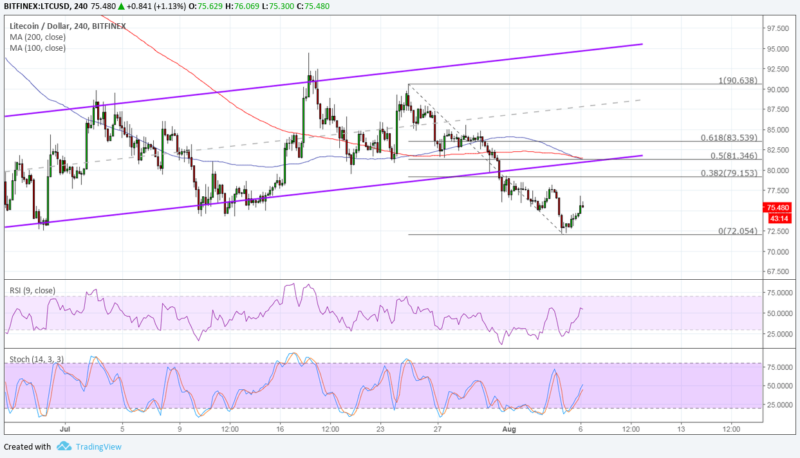
LTC/USD broke below its ascending channel on the 4-hour time frame to signal that a reversal from the uptrend is due. Price bounced off the $72 level to indicate that a correction might be needed before it heads further south.
Applying the Fibonacci retracement tool on the latest swing high and low shows that the 50% level lines up with the broken channel support that might now hold as resistance. This also lines up with the dynamic inflection points at the moving averages.
On the subject of moving averages, the 100 SMA is starting to cross below the longer-term 200 SMA to indicate that the path of least resistance is to the downside. In other words, the selloff is more likely to resume than to reverse.
RSI is still heading higher, though, so buyers might have some energy left in them to push LTC/USD up while sellers take a break. Similarly stochastic is moving up so LTC/USD might follow suit. Once both oscillators hit overbought levels and turn back down, selling pressure could return and lead to another test of the $72 level.
LTC/USD joined most of its digital currency peers on the losing end for the previous week, bogged down by the HitBTC outage and South Korea’s plans to tax cryptocurrency exchanges. It didn’t help that the industry was coming off a shaky performance the other week when the SEC shelved its decision for some bitcoin ETF applications.
Cryptocurrencies could really use a dose of positive news to sustain their rallies from the earlier month, otherwise risking yet another downbeat performance and test of long-term lows. Some warned that LTC/USD and its peers are far from bottoming out and have yet to show more signs of recovering in the latter part of this year.
So far, there have been no major updates from Litecoin’s end, which makes it all the more difficult to sustain any rallies.
Images courtesy of TradingView, Shutterstock