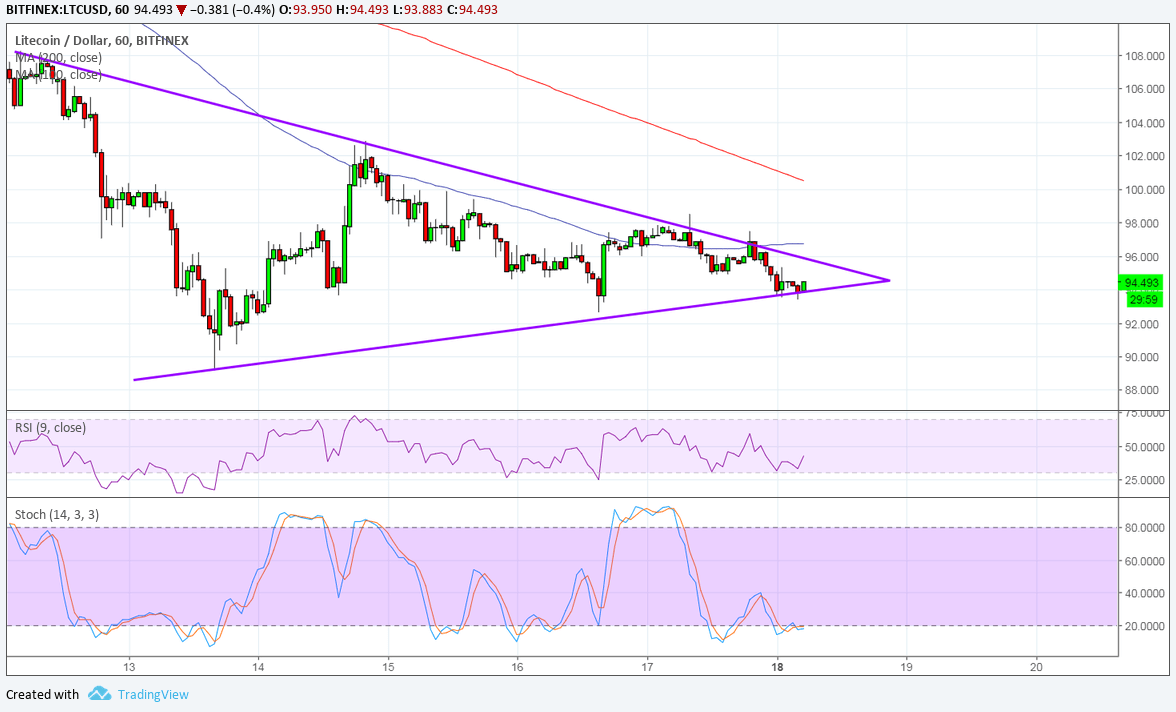
LTCUSD has formed lower highs and higher lows to create a symmetrical triangle pattern on its 1-hour chart. Price is approaching the peak of the formation so a breakout could happen any moment now.
The 100 SMA is below the longer-term 200 SMA, hinting that the path of least resistance is to the downside. In other words, a break lower is more likely to happen than a break higher. A long red candle closing below the $94 level could be enough to confirm a bearish move and a corresponding downtrend.
The triangle pattern spans $90 to $106 so the resulting drop could be of the same height. Similarly, a break higher could be followed by a rally of the same size. However, LTCUSD has to break past the 100 SMA dynamic resistance at the top of the triangle.
The gap between the moving averages is narrowing to signal slowing bearish momentum. RSI is also turning higher so LTCUSD might follow suit while bulls regain control. Stochastic also looks ready to move up to draw buyers in, and a slight bullish divergence can be seen as well.

LTCUSD is struggling to hold its ground as it was able to take advantage of the bounce among cryptocurrencies last week but is also sliding to dollar strength. Safe-haven demand is in play after the US announced tariffs on China and the latter responded with retaliatory measures.
Further updates on trade tensions could dictate LTCUSD direction as markets appear to be moving mostly on sentiment these days. As for cryptocurrencies themselves, investors are still holding out for the results of the US regulators’ probe into price manipulation.
Evidence suggesting that these practices were prevalent in pushing bitcoin or litecoin prices in a particular direction could undermine trust in the industry and spur a break lower for LTCUSD.


