
- Ripple price is showing positive signs above the $0.5000 and $0.5200 resistance levels against the US dollar.
- The price is now well above $0.5200 and the 55 simple moving average (4-hours).
- There is a major contracting triangle forming with resistance near $0.5645 on the 4-hours chart of the XRP/USD pair (data source from Bittrex).
- The pair is likely to surge further above the $0.5850 and $0.6000 resistance levels.
Ripple price is trading in a positive zone above the $0.5200 resistance against the US Dollar. XRP price is likely to gain strength once there is a close above the $0.6000 level.
Ripple Price Analysis
After retesting the $0.4500 and $0.4660 support levels, ripple price started a fresh increase against the US Dollar. The XRP/USD pair broke many hurdles near $0.5000 and $0.5050 to move into a positive zone.
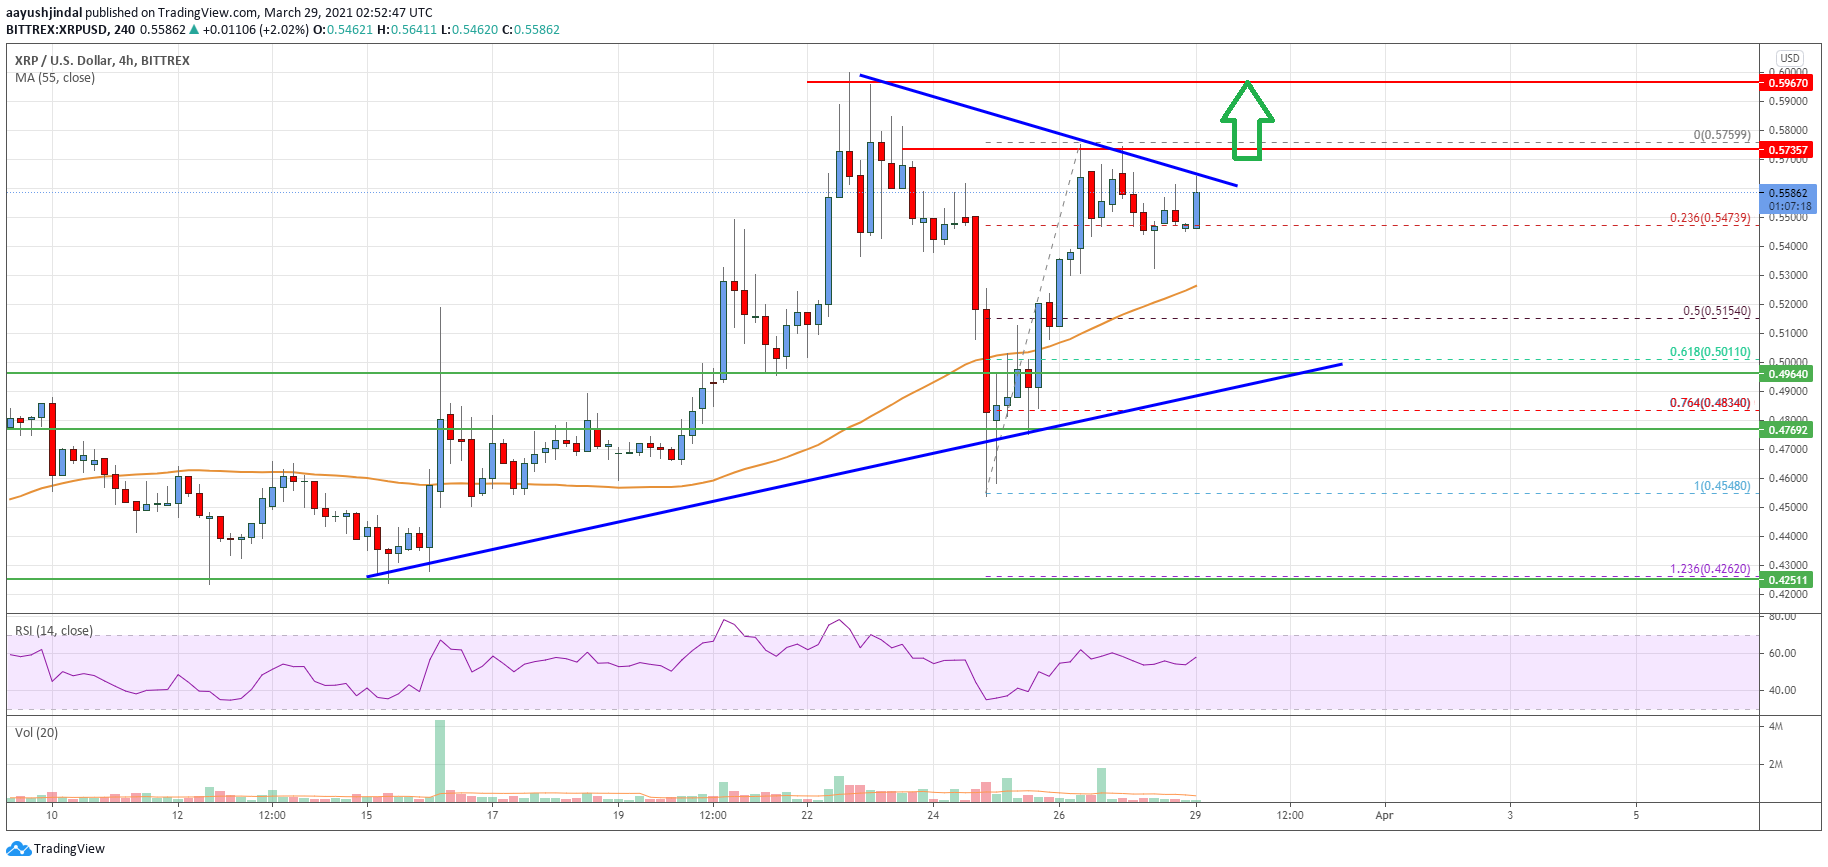
There was also a close above the $0.5200 level and the 55 simple moving average (4-hours). The price even spiked above the $0.5500 level and recently traded as high as $0.5759. XRP is now consolidating gains above the $0.5500 support zone.
It tested the 23.6% Fib retracement level of the upward move from the $0.4548 swing low to $0.5759 high. There is also a major contracting triangle forming with resistance near $0.5645 on the 4-hours chart of the XRP/USD pair.
If there is an upside break above the triangle resistance, the pair could test the $0.5950 and $0.6000 resistance levels. A successful daily close above the $0.6000 level could further accelerate gains. In the stated case, the price could even surge towards the $0.6400 and $0.6500 levels.
On the downside, an initial support is near the $0.5300 level and the 55 simple moving average (4-hours). The first major support is near the $0.5150 level.
The 50% Fib retracement level of the upward move from the $0.4548 swing low to $0.5759 high is also near $0.5150. The main support is now forming near the triangle trend line and $0.5000. If there is a downside break below the $0.5000 support, the price could $0.4500.
Looking at the chart, ripple price is clearly trading in a positive zone above the $0.5200 zone and the 55 simple moving average (4-hours). Overall, the price is likely to surge further above the $0.5850 and $0.6000 resistance levels.
Technical indicators
4 hours MACD – The MACD for XRP/USD is now gaining momentum in the bullish zone.
4 hours RSI (Relative Strength Index) – The RSI for XRP/USD is well above the 50 level.
Key Support Levels – $0.5300, $0.5150 and $0.5000.
Key Resistance Levels – $0.5650 and $0.6000.


Leave a Reply
You must be logged in to post a comment.