- Ripple price started a fresh increase above the $0.60 zone against the US dollar.
- The price is now trading above $0.7000 and the 55 simple moving average (4-hours).
- There was a break above a key bearish trend line with resistance near $0.6680 on the 4-hours chart of the XRP/USD pair (data source from Bittrex).
- The pair could continue to move up if it clears the $0.7250 resistance level.
Ripple price is trading in a bullish zone above $0.6000 against the US Dollar, like bitcoin. XRP price could extend increase if it clears the $0.7250 resistance zone.
Ripple Price Analysis
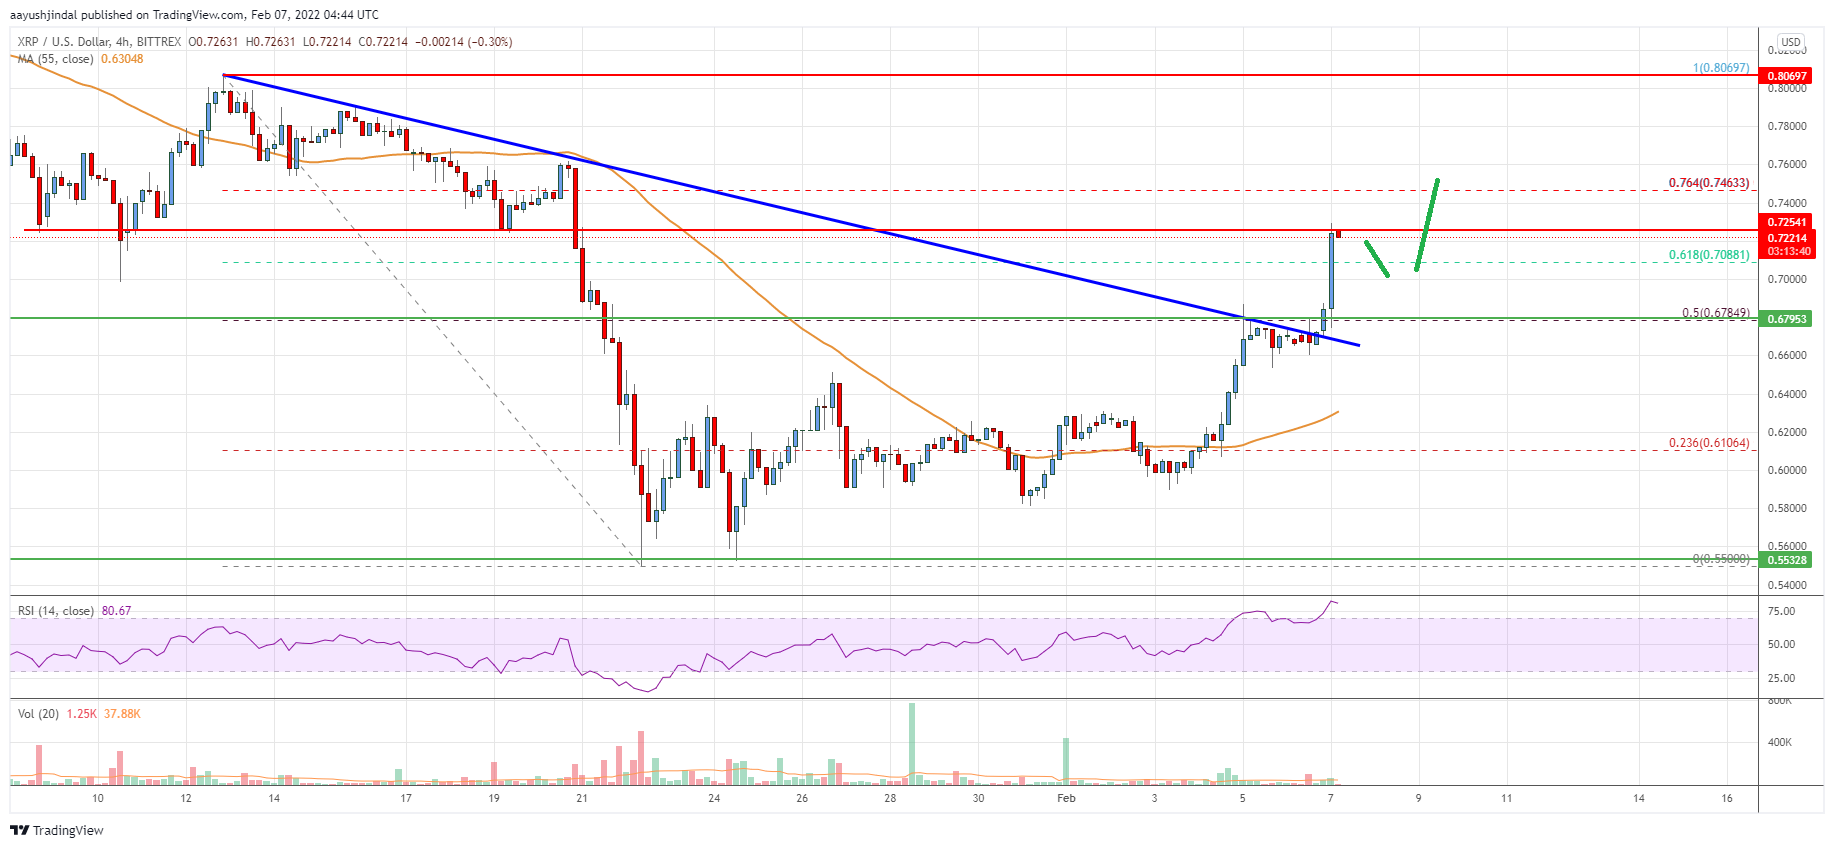
After a major decline, ripple price found support near the $0.5500 zone against the US Dollar. The XRP/USD pair formed a base and started a steady increase above the $0.6000 resistance zone.
The pair gained pace after it cleared the $0.6200 and $0.6250 levels. Besides, there was a break above a key bearish trend line with resistance near $0.6680 on the 4-hours chart of the XRP/USD pair. The pair even broke the 50% Fib retracement level of the downward move from the $0.8070 swing high to $0.5500 low.
It is now trading above $0.7000 and the 55 simple moving average (4-hours). An immediate resistance is near the $0.7250 level. The next key resistance is near the $0.7450 level.
The 76.4% Fib retracement level of the downward move from the $0.8070 swing high to $0.5500 low is also near the $0.7450 level to act as a resistance. Any more gains could lead the price towards the $0.8200 level. If there is no upside break above $0.7250, the price could correct lower.
An immediate support on the downside is near the $0.7020 level. The next major support is near the $0.6500 level and the broken trend line. Any more losses could lead the price towards the $0.6200 level and the 55 simple moving average (4-hours) in the near term.

Looking at the chart, ripple price is now trading above $0.7000 and the 55 simple moving average (4-hours). Overall, the price could continue to move up if it clears the $0.7250 resistance level.
Technical indicators
4 hours MACD – The MACD for XRP/USD is now gaining momentum in the bullish zone.
4 hours RSI (Relative Strength Index) – The RSI for XRP/USD is in the overbought zone.
Key Support Levels – $0.7020, $0.6500 and $0.6200.
Key Resistance Levels – $0.7250 and $0.7450.


Leave a Reply
You must be logged in to post a comment.