- Ripple price started a fresh decline from the $0.6500 zone against the US dollar.
- The price is now trading below $0.6000 and the 55 simple moving average (4-hours).
- There is a key bearish trend lien forming with resistance near $0.6800 on the 4-hours chart of the XRP/USD pair (data source from Bittrex).
- The pair could continue to move down if there is a move below the $0.5500 support.
Ripple price is trading in a bearish zone below $0.6000 against the US Dollar, like bitcoin. XRP price could extend decline if there is a move below the $0.5500 support.
Ripple Price Analysis
After struggling to stay above the $0.7000 zone, ripple price started a fresh decline against the US Dollar. The XRP/USD pair declined below the $0.6000 support zone to move into a bearish zone.
The pair declined below the $0.5800 level and the 55 simple moving average (4-hours). The pair traded as low as $0.5500 and recently corrected higher. There was a correction above the $0.6000 level. The price even climbed above the 23.6% Fib retracement level of the downward move from the $0.8069 swing high to $0.5500 low.
However, the bears are active near the $0.6500 zone. The next key resistance is near the $0.6800 level. There is also a key bearish trend lien forming with resistance near $0.6800 on the 4-hours chart of the XRP/USD pair.
The trend line is near the 50% Fib retracement level of the downward move from the $0.8069 swing high to $0.5500 low. A close above the $0.6800 level could push the price towards the $0.7200 level.
The next major resistance is near the $0.7500 level. Any more gains could lead the price towards the $0.80 level. If there is no upside break above $0.6500, the price could resume its decline.
The next major support is near the $0.5500 level. Any more losses could lead the price towards the $0.4500 level in the near term.
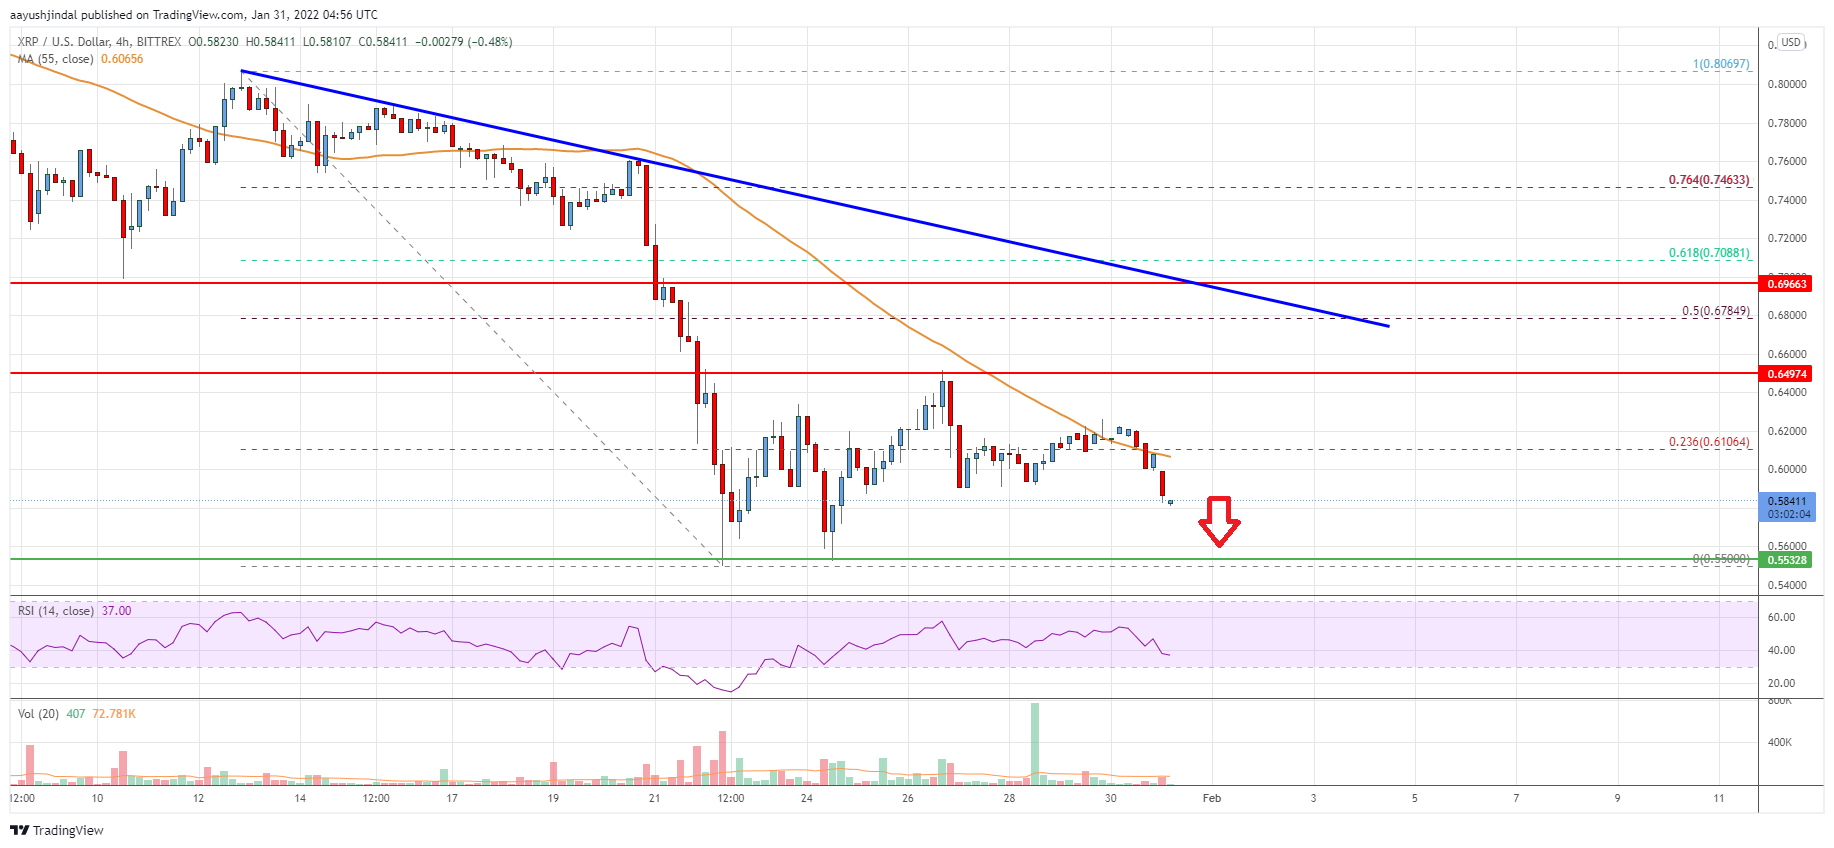
Looking at the chart, ripple price is now trading below $0.6000 and the 55 simple moving average (4-hours). Overall, the price could continue to move down if there is a move below the $0.5500 support.
Technical indicators
4 hours MACD – The MACD for XRP/USD is now gaining momentum in the bearish zone.
4 hours RSI (Relative Strength Index) – The RSI for XRP/USD is below the 50 level.
Key Support Levels – $0.5600, $0.5500 and $0.5000.
Key Resistance Levels – $0.6500 and $0.6800.
