
- Ripple price started a fresh increase after it cleared the $0.2500 resistance against the US dollar.
- The price is now trading well above the $0.2520 pivot level and the 55 simple moving average (4-hours).
- There are two bullish trend lines forming with support near $0.2520 and $0.2480 on the 4-hours chart of the XRP/USD pair (data source from Bittrex).
- The pair is likely to start a fresh rally if it clears the $0.2590 and $0.2600 resistance levels.
Ripple price is trading is a bullish zone above $0.2520 against the US Dollar. XRP price is likely to accelerate further higher if it settles above the $0.2600 resistance zone.
Ripple Price Analysis
This past week, there was a strong increase in ripple price from the $0.2400 support zone against the US Dollar. The XRP/USD pair gained pace and broke many important hurdles near $0.2500 and $0.2520.
There was also a close above the $0.2520 pivot level and the 55 simple moving average (4-hours). The pair rallied further above the $0.2600 resistance. It traded to a new monthly high near $0.2636 before starting a downside correction.
It declined below the $0.2550 and $0.2520 support levels, but remained well bid near $0.2500. A low is formed near $0.2502 and the price is currently rising. It broke the $0.2550 resistance level, plus the 23.6% Fib retracement level of the recent decline from the $0.2638 high to $0.2502 low.
An initial resistance is near the $0.2570 zone. It is close to the 50% Fib retracement level of the recent decline from the $0.2638 high to $0.2502 low. The main resistance is near the $0.2590 and $0.2600 levels, above which the price is likely to start a fresh rally.
On the downside, there are two bullish trend lines forming with support near $0.2520 and $0.2480 on the 4-hours chart of the XRP/USD pair.
The first trend line is important since it is close to the $0.2520 pivot level and the 55 simple moving average (4-hours). To start a strong decline, the bears need to gain pace below the $0.2500 and $0.2480 support levels.
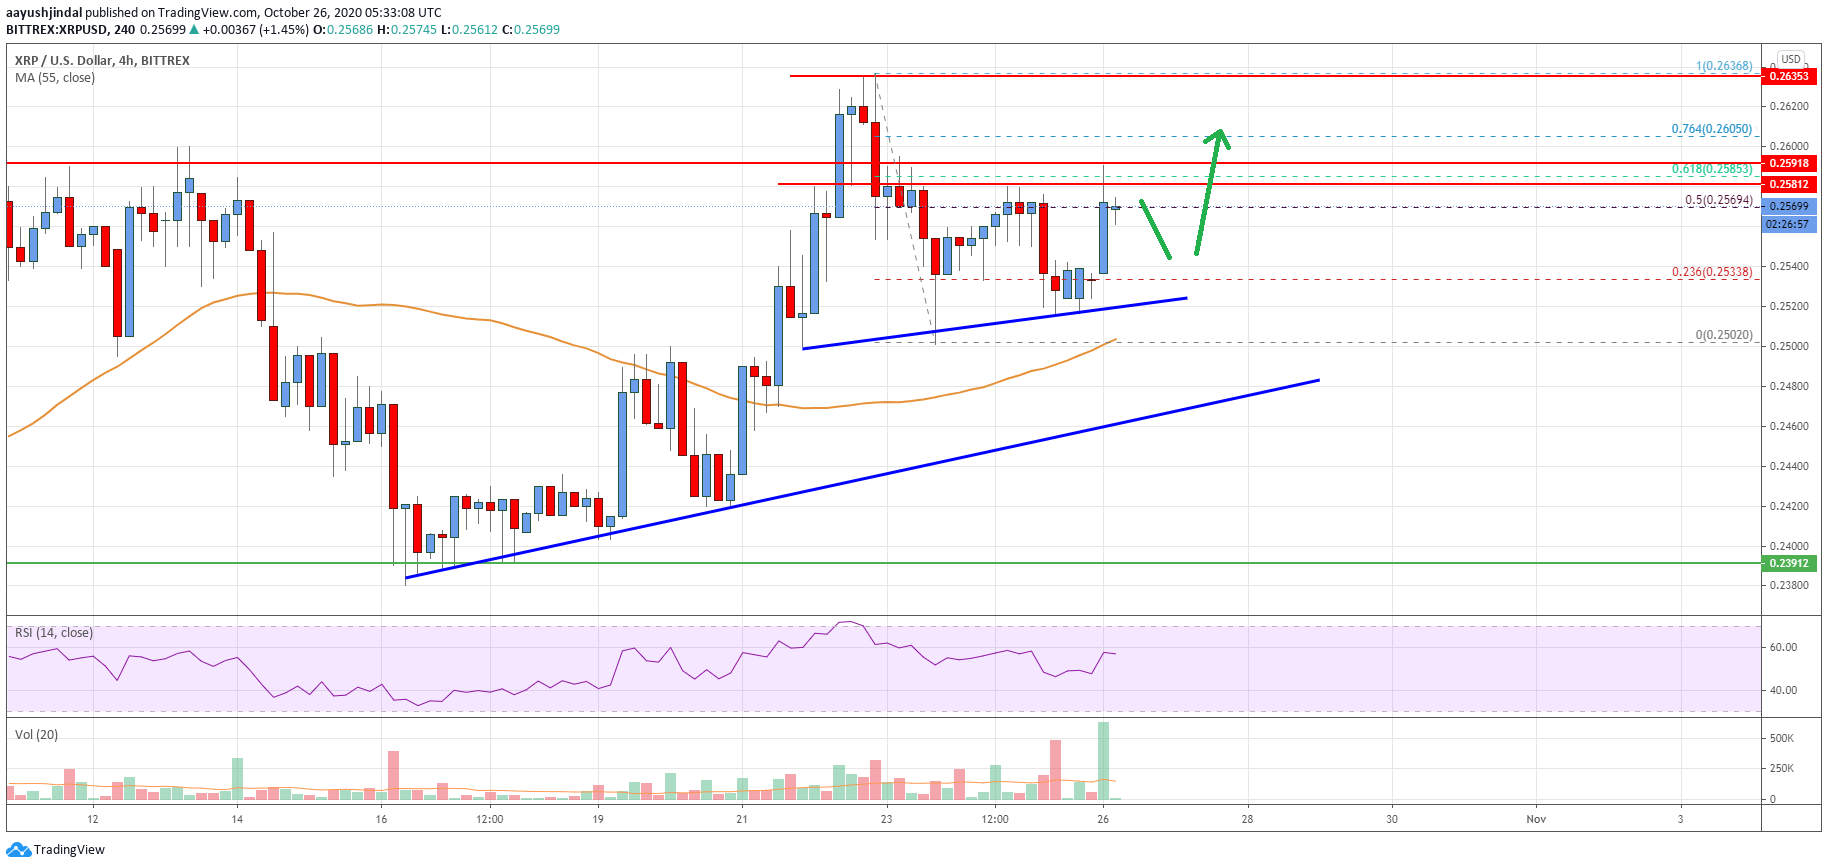
Looking at the chart, ripple price is clearly trading nicely above the $0.2520 pivot level and the 55 simple moving average (4-hours). Therefore, the price is likely to start a fresh rally if it clears the $0.2590 and $0.2600 resistance levels.
Technical indicators
4 hours MACD – The MACD for XRP/USD is moving nicely in the bullish zone.
4 hours RSI (Relative Strength Index) – The RSI for XRP/USD is still well above the 50 level.
Key Support Levels – $0.2520, $0.2500 and $0.2480.
Key Resistance Levels – $0.2570 and $0.2600.


Leave a Reply
You must be logged in to post a comment.