
- Ripple price started a fresh decline after it faced as strong resistance near $0.2600 against the US dollar.
- The price is now trading well below the $0.2480 pivot level and the 55 simple moving average (4-hours).
- There was a break below a key bullish trend line with support near $0.2500 on the 4-hours chart of the XRP/USD pair (data source from Bittrex).
- The pair is likely to continue lower if there is a clear break below the $0.2380 support.
Ripple price is trading is a negative zone below $0.2500 against the US Dollar. XRP price is likely to continue lower if fails to recover above $0.2450 and $0.2480.
Ripple Price Analysis
In the past few sessions, there was a steady decline in ripple price from the $0.2600 resistance against the US Dollar. The XRP/USD pair formed a high near $0.2599 before it started a fresh decline.
There was a break below the $0.2520 and $0.2500 support levels. Moreover, there was a break below a key bullish trend line with support near $0.2500 on the 4-hours chart of the XRP/USD pair. The pair even broke the $0.2450 support and settled well below the 55 simple moving average (4-hours).
A low is formed near $0.2379 and the price is currently consolidating losses above $0.2400. An initial resistance is near the $0.2430 level since it is close to the 23.6% Fib retracement level of the recent decline from the $0.2599 high to $0.2379 low.
It seems like there is a short-term contracting triangle forming with resistance near $0.2430 level. If there is an upside break above the $0.2430 resistance, the price might recover above $0.2450.
The next major resistance is near the $0.2485 level. It is close to the 50% Fib retracement level of the recent decline from the $0.2599 high to $0.2379 low, and the 55 simple moving average (4-hours). A close above the $0.2485 resistance and the 55 simple moving average (4-hours) is must for a possible bullish break.
Conversely, the price might decline below the $0.2400 and $0.2380 support levels to continue lower. The next major support is near the $0.2350 level.
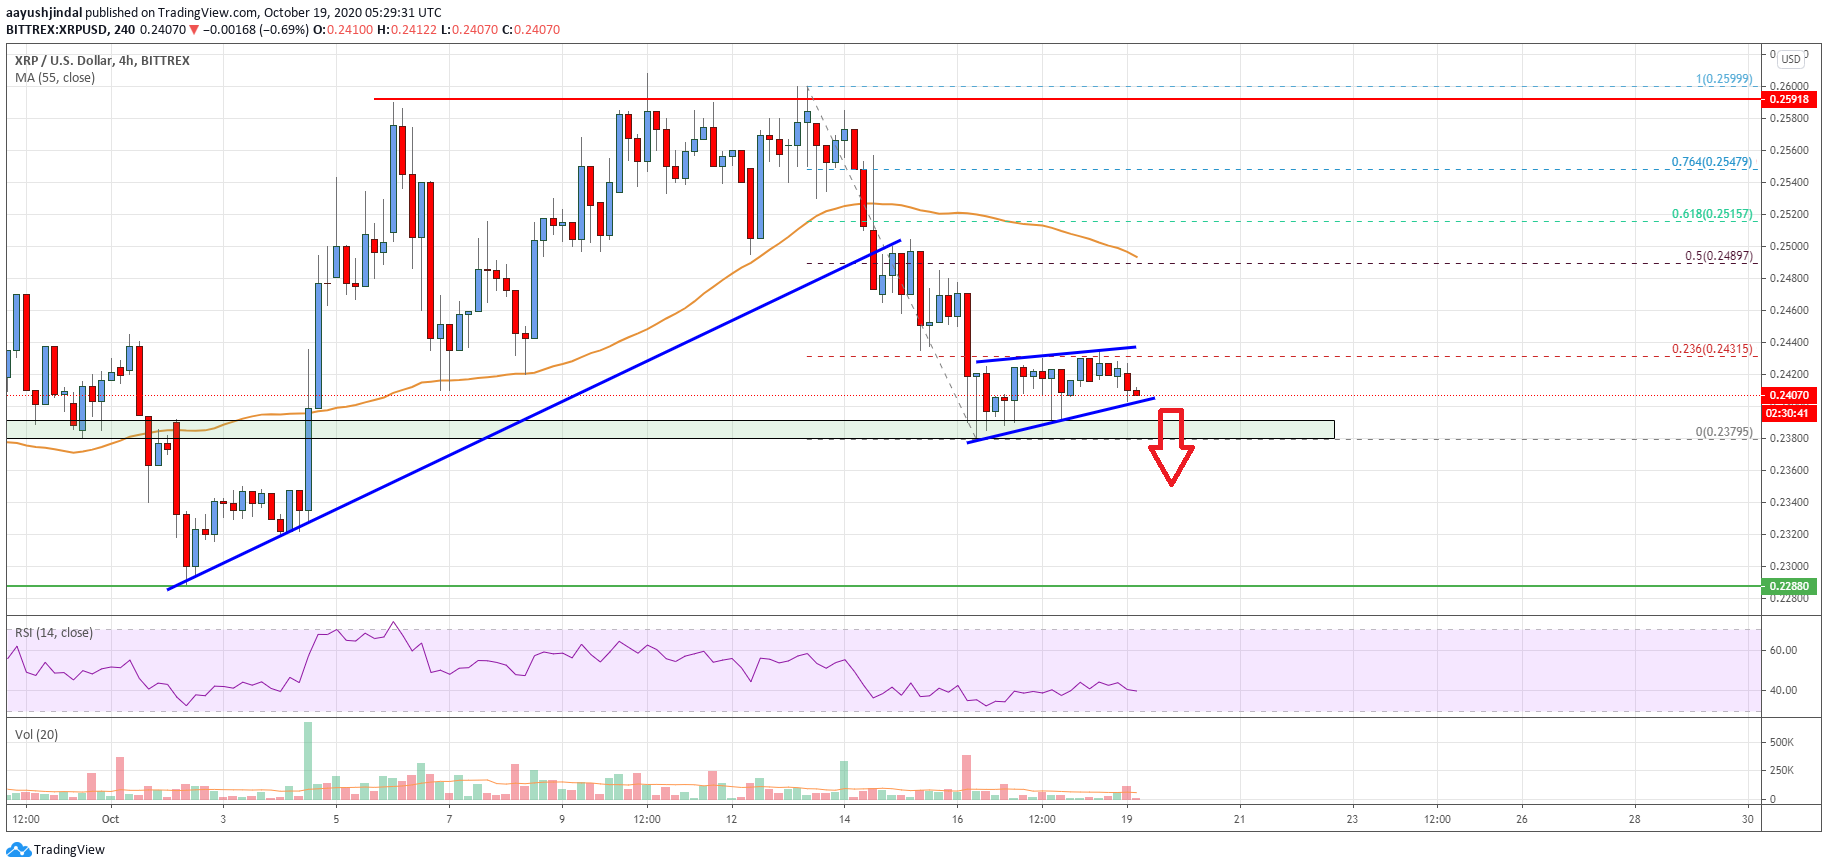
Looking at the chart, ripple price is clearly trading well below the $0.2480 pivot level and the 55 simple moving average (4-hours). Therefore, the price is likely to continue lower if there is a clear break below the $0.2380 support.
Technical indicators
4 hours MACD – The MACD for XRP/USD is showing negative signs in the bullish zone.
4 hours RSI (Relative Strength Index) – The RSI for XRP/USD is now well below the 50 level.
Key Support Levels – $0.2400, $0.2380 and $0.2350.
Key Resistance Levels – $0.2430 and $0.2480.


Leave a Reply
You must be logged in to post a comment.