- Ripple price is gaining pace above the $0.2400 and $0.2450 resistance levels against the US dollar.
- The price is now trading nicely above $0.2450 and the 55 simple moving average (4-hours).
- There was a break above a major contracting triangle with resistance near $0.2415 on the 4-hours chart of the XRP/USD pair (data source from Bittrex).
- The pair could gain bullish momentum if it manages to clear the $0.2550 resistance zone.
Ripple price is trading with a bullish bias above $0.2420 against the US Dollar. XRP price is likely to continue higher if it clears the $0.2550 resistance zone.
Ripple Price Analysis
After a few failed attempts near $0.2450, ripple price started a downside correction against the US Dollar. The XRP/USD pair broke the $0.2350 support level, but it managed to stay above the $0.2300 support.
A low is formed near $0.2290 and the price started a fresh increase. It gained pace and surged above the $0.2320 and $0.2350 resistance levels. Moreover, there was a break above a major contracting triangle with resistance near $0.2415 on the 4-hours chart of the XRP/USD pair.
The pair is now trading nicely above $0.2450 and the 55 simple moving average (4-hours). It spiked towards the $0.2550 resistance and traded as high as $0.2544.
Ripple is currently correcting lower and trading near the $0.2500 support. It is close to the 23.6% Fib retracement level of the upward move from the $0.2290 low to $0.2544 high. On the downside, the previous resistance near the $0.2450 level is likely to act as a strong support.
The next key support is near the broken triangle resistance, and the 50% Fib retracement level of the upward move from the $0.2290 low to $0.2544 high. The 55 simple moving average (4-hours) is also near the $0.2400 level.
On the upside, the price is facing a major hurdle near the $0.2550 level. A successful close above the $0.2550 resistance level may perhaps accelerate the recent increase. The next major resistance is near the $0.2620 level, above which the price may even test the $0.2750 level.
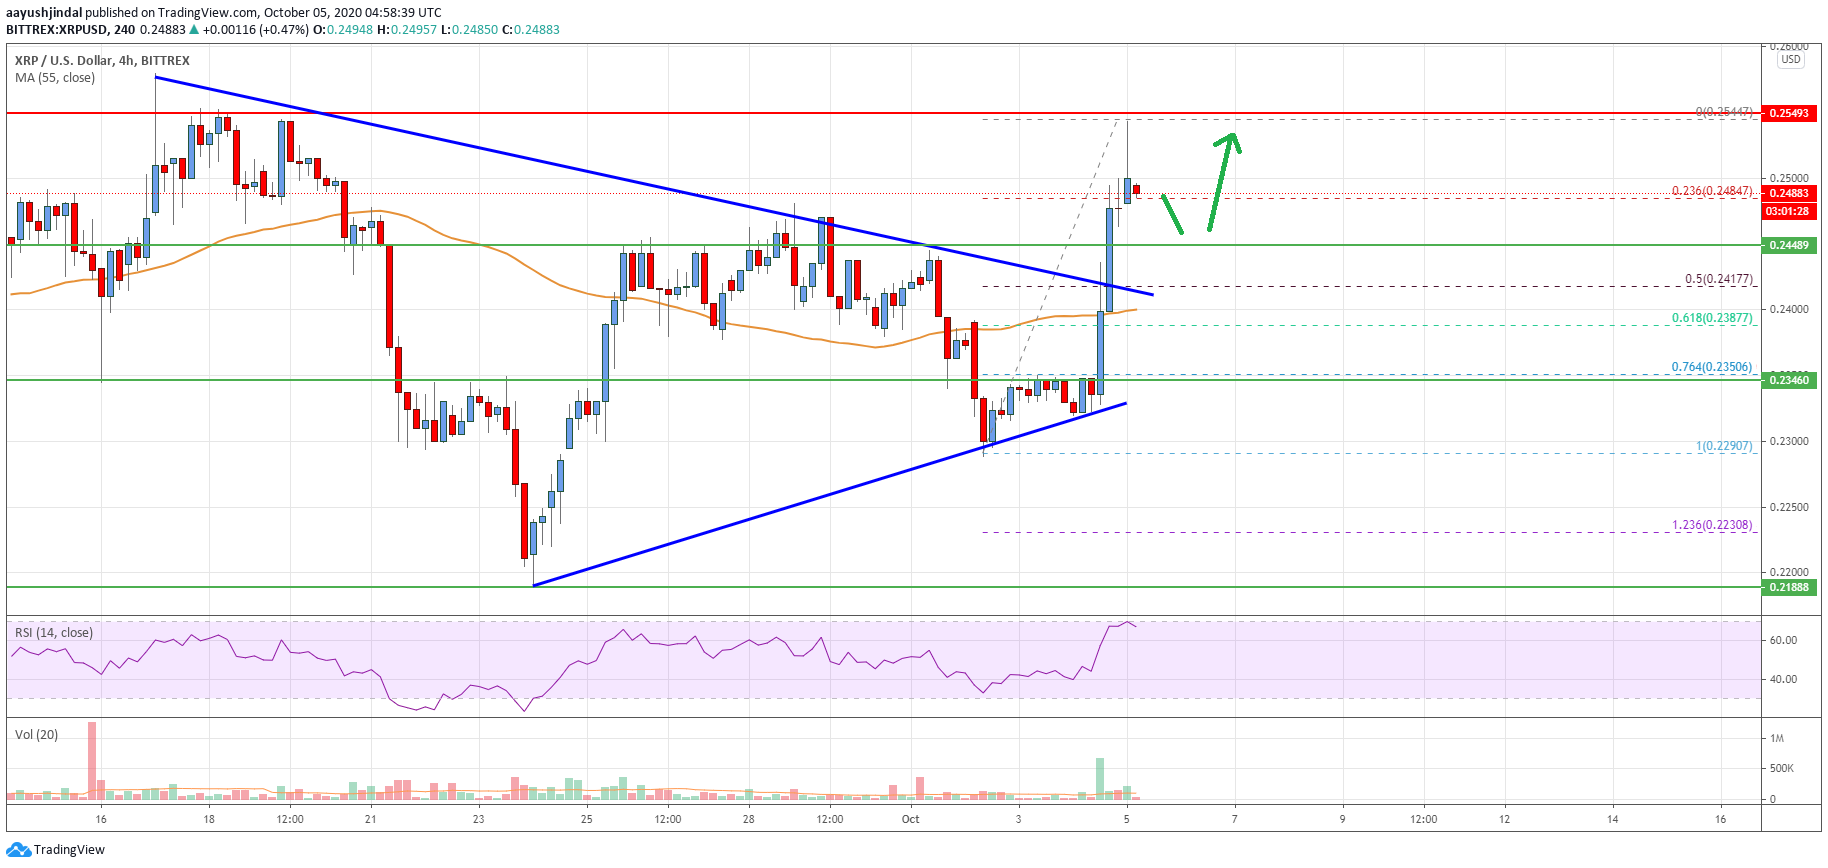
Looking at the chart, ripple price is clearly trading nicely above $0.2450 and the 55 simple moving average (4-hours). Therefore, the price could gain bullish momentum if it manages to clear the $0.2550 resistance zone.
Technical indicators
4 hours MACD – The MACD for XRP/USD is showing positive signs in the bullish zone.
4 hours RSI (Relative Strength Index) – The RSI for XRP/USD is now well above the 60 level.
Key Support Levels – $0.2450, $0.2400 and $0.2350.
Key Resistance Levels – $0.2540 and $0.2550.