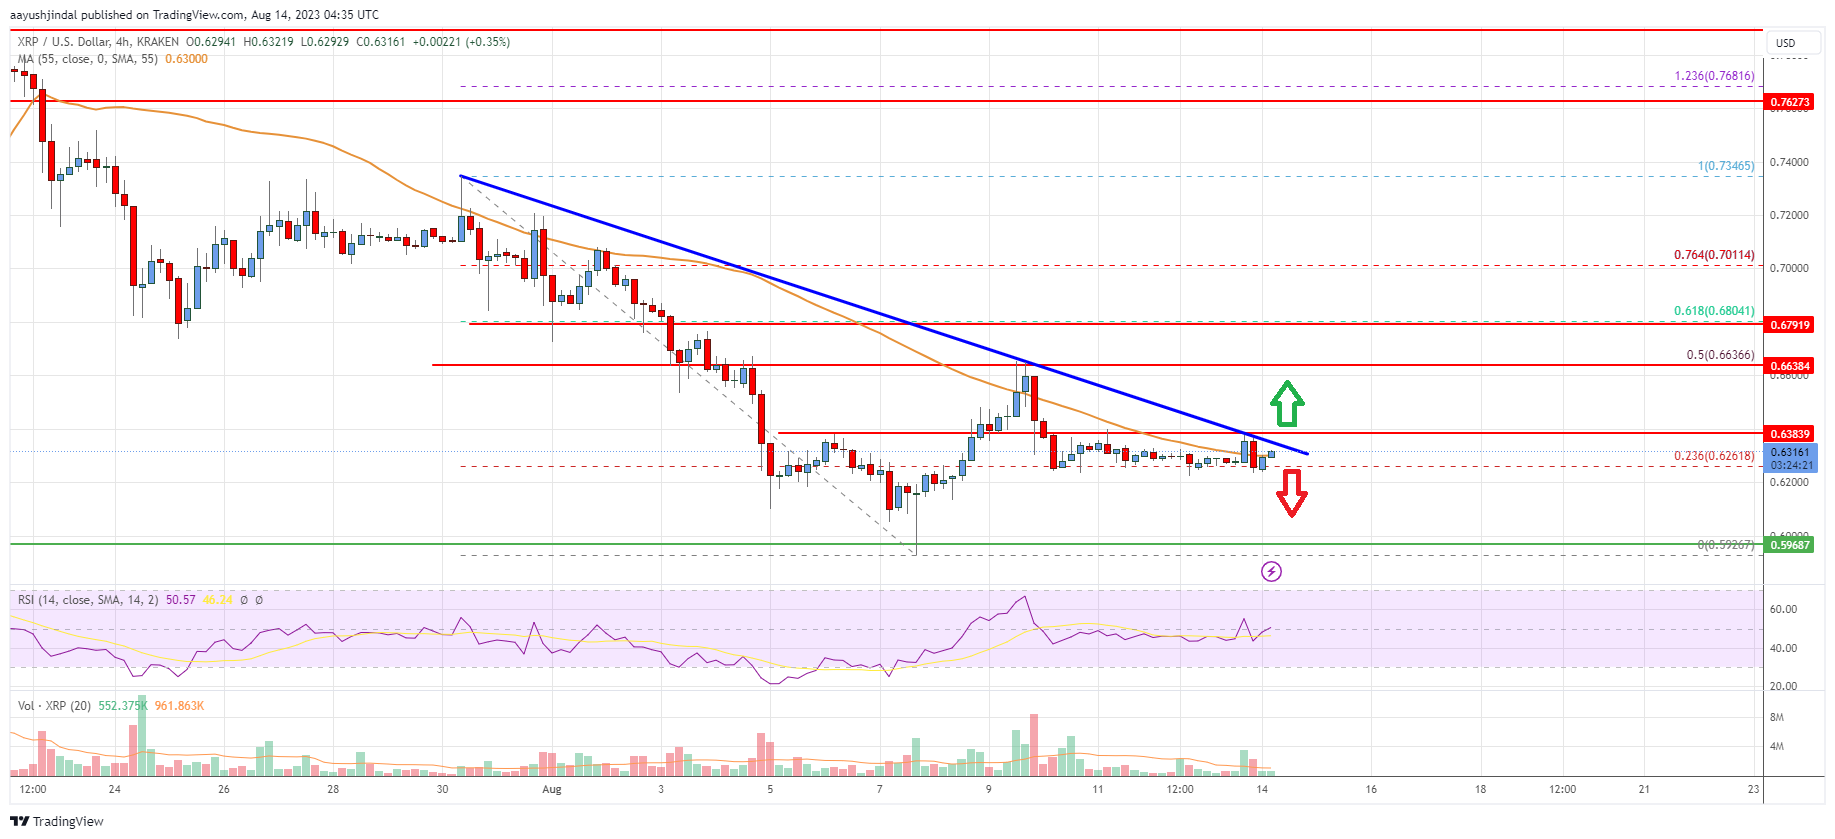
- Ripple price is facing resistance near the $0.680 level against the US dollar.
- The price is now trading near $0.625 and the 55 simple moving average (4 hours).
- There is a key bearish trend line forming with resistance near $0.635 on the 4-hour chart of the XRP/USD pair (data source from Kraken).
- The pair could start another decline if it stays below $0.665 and $0.680.
Ripple price is struggling below $0.665 against the US Dollar, unlike Bitcoin. XRP price must stay above the $0.620 support to start a recovery wave.
Ripple Price Analysis
After struggling to stay above $0.680, Ripple price started a fresh decline against the US Dollar. The XRP/USD pair gained bearish momentum below the 0.665 support zone.
The bears were able to push the price below the $0.62 support. A low was formed near $0.5926 and the pair is now attempting a recovery wave. There was a test of the 50% Fib retracement level of the downward move from the $0.7346 swing high to the $0.5926 low.
The price is now trading near $0.625 and the 55 simple moving average (4 hours). There is also a key bearish trend line forming with resistance near $0.635 on the 4-hour chart of the XRP/USD pair.
On the upside, the price is facing resistance near $0.635. The next major resistance is near the $0.665 level. A clear move above the $0.665 resistance zone might start a steady increase. In the stated case, the price could test the $0.680 resistance.
The 61.8% Fib retracement level of the downward move from the $0.7346 swing high to the $0.5926 low is near $0.680 to act as a barrier. Any more gains might send the price toward the $0.720 resistance.
Initial support on the downside is near the $0.620 level. The next major support is near the $0.600 level, below which the price could accelerate lower toward the $0.5850 support. Any more losses could lead the price toward the $0.550 level.

Looking at the chart, Ripple price is now trading near the $0.625 zone and the 55 simple moving average (4 hours). Overall, the price could start another decline if it stays below $0.665 and $0.680.
Technical indicators
4 hours MACD – The MACD for XRP/USD is now losing momentum in the bearish zone.
4 hours RSI (Relative Strength Index) – The RSI for XRP/USD is below the 50 level.
Key Support Levels – $0.620, $0.600, and $0.585.
Key Resistance Levels – $0.665 and $0.680.