- Ripple price recently failed to break a crucial resistance area near the $0.3500 level against the US dollar.
- The price declined below $0.3300, but it stayed above the $0.3140 support area.
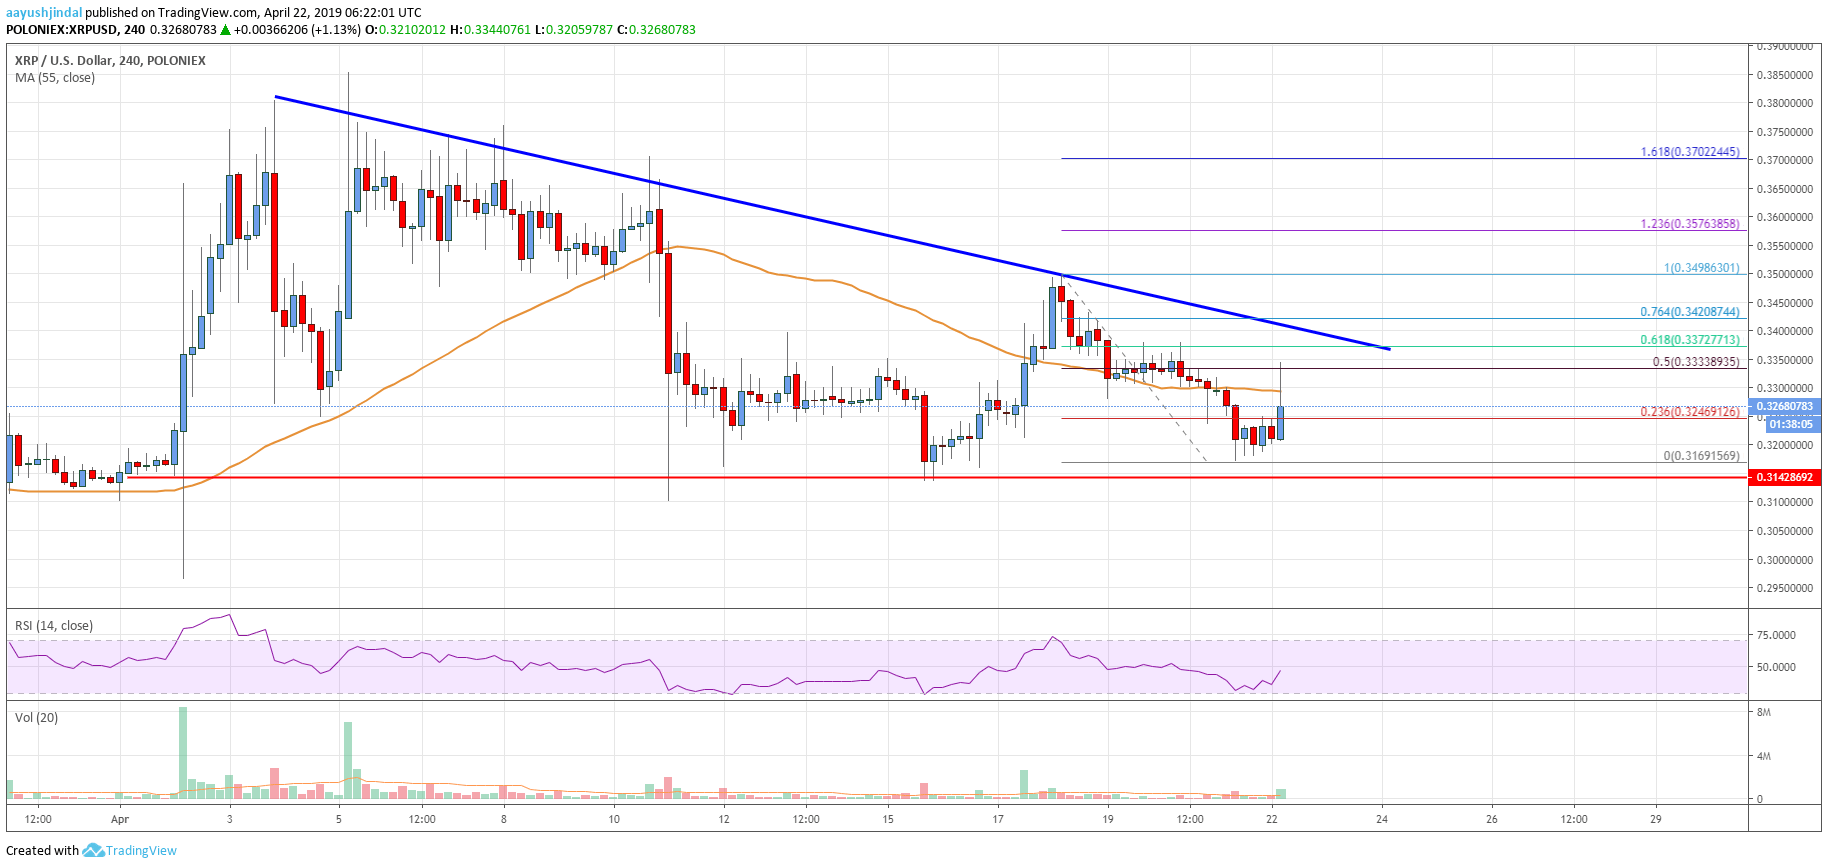
- There is a significant bearish trend line in place with resistance at $0.3380 on the 4-hours chart of the XRP/USD pair (data source from Poloniex).
- The price must break the $0.3400 resistance area to move into a positive zone and accelerate higher.
Ripple price is facing many hurdles on the upside near $0.3400 against the US Dollar. XRP could trade in a range before the next break either above $0.3400 or below $0.3140.
Ripple Price Analysis
This past week, there was a decent rebound in bitcoin, Ethereum, bitcoin cash, ADA and ripple against the US Dollar. The XRP/USD pair formed a strong support base near $0.3140 and later jumped above the $0.3300 and $0.3400 levels. There was even a break above the $0.3440 level and the 55 simple moving average (4-hours). However, the price struggled to clear the $0.3500 resistance area. A swing high was formed at $0.3498 before the pair started a sharp decline.
It broke the $0.3350 level and the 55 simple moving average (4-hours) to move into a bearish zone. The price even broke the $0.3200 support and traded towards the main $0.3140 support area. A new swing low was formed at $.3169 and the price is currently correcting higher. It spiked towards the $0.3330 level and the 50% Fib retracement level of the last downward move from the $0.3498 high to $0.3169 low. To the topside, there is a strong resistance formed near $0.3400.
There is also a significant bearish trend line in place with resistance at $0.3380 on the 4-hours chart of the XRP/USD pair. The trend line coincides with the 61.8% Fib retracement level of the last downward move from the $0.3498 high to $0.3169 low. Therefore, a successful close above the trend line and $0.3400 is needed for the bulls to gain momentum. The next resistance is at $0.3500, where sellers may take a stand.

Looking at the chart, ripple price is clearly facing a lot of hurdles near the $0.3380 and $0.3400 levels. If buyers gain strength above $0.3400, there could be sharp gains above $0.3450 and $0.3500. The price may even climb towards the $0.3850 level. Conversely, if there is a downside break below the $0.3140 support, the price could tumble towards $0.3000 or even $0.2920.
Technical indicators
4 hours MACD – The MACD for XRP/USD is slowly gaining pace in the bullish zone.
4 hours RSI (Relative Strength Index) – The RSI for XRP/USD jumped higher towards the 50 level.
Key Support Levels – $0.3350, $0.3380 and $0.3400.
Key Resistance Levels – $0.3180 and $0.3140.


Leave a Reply
You must be logged in to post a comment.