- Ripple price is facing a strong resistance near the $0.2650 level against the US dollar.
- The price is currently consolidating and is trading above the $0.2580 support area.
- There was a break above a crucial bearish trend line with resistance near $0.2585 on the 4-hours chart of the XRP/USD pair (data source from Bittrex).
- The price could sharply climb higher if there is a daily close above the key $0.2650 resistance area.
Ripple price is trading in a broad range below $0.2650 against the US Dollar. XRP price is likely to break the $0.2650 resistance as long as it is above $0.2550.
Ripple Price Analysis
This past week, there were mostly range moves in bitcoin, Ethereum, bitcoin cash, litecoin and ripple against the US Dollar. The XRP/USD pair traded higher above the $0.2600 levels. However, the price failed once again to break the $0.2650 resistance area. As a result, the price declined back towards the $0.2500 range support area. A swing low was formed near $0.2508 and the price corrected higher.
It broke the $0.2550 resistance level and the 55 simple moving average (4-hours). The upward move was decent since there was a break above the $0.2600 resistance. Moreover, there was a break above a crucial bearish trend line with resistance near $0.2585 on the 4-hours chart of the XRP/USD pair. The pair once again tested the $0.2650 resistance area and it is currently correcting lower.
There was a break below the $0.2600 level plus the 23.6% Fib retracement level of the recent upward move from the $0.2508 low to $0.2658 high. However, the $0.2580 area is acting as a strong support base. Moreover, the 55 simple moving average (4-hours) is also near the $0.2580 level. Finally, the 50% Fib retracement level of the recent upward move from the $0.2508 low to $0.2658 high is at $0.2583.
Therefore, ripple price is likely to bounce back as long as it is trading above the $0.2580 support area. On the upside, the main resistance is near the $0.2650 level. If there is a convincing close above the $0.2650 level, the price could accelerate higher. The next key resistances are near the $0.2700 and $0.2720 levels.
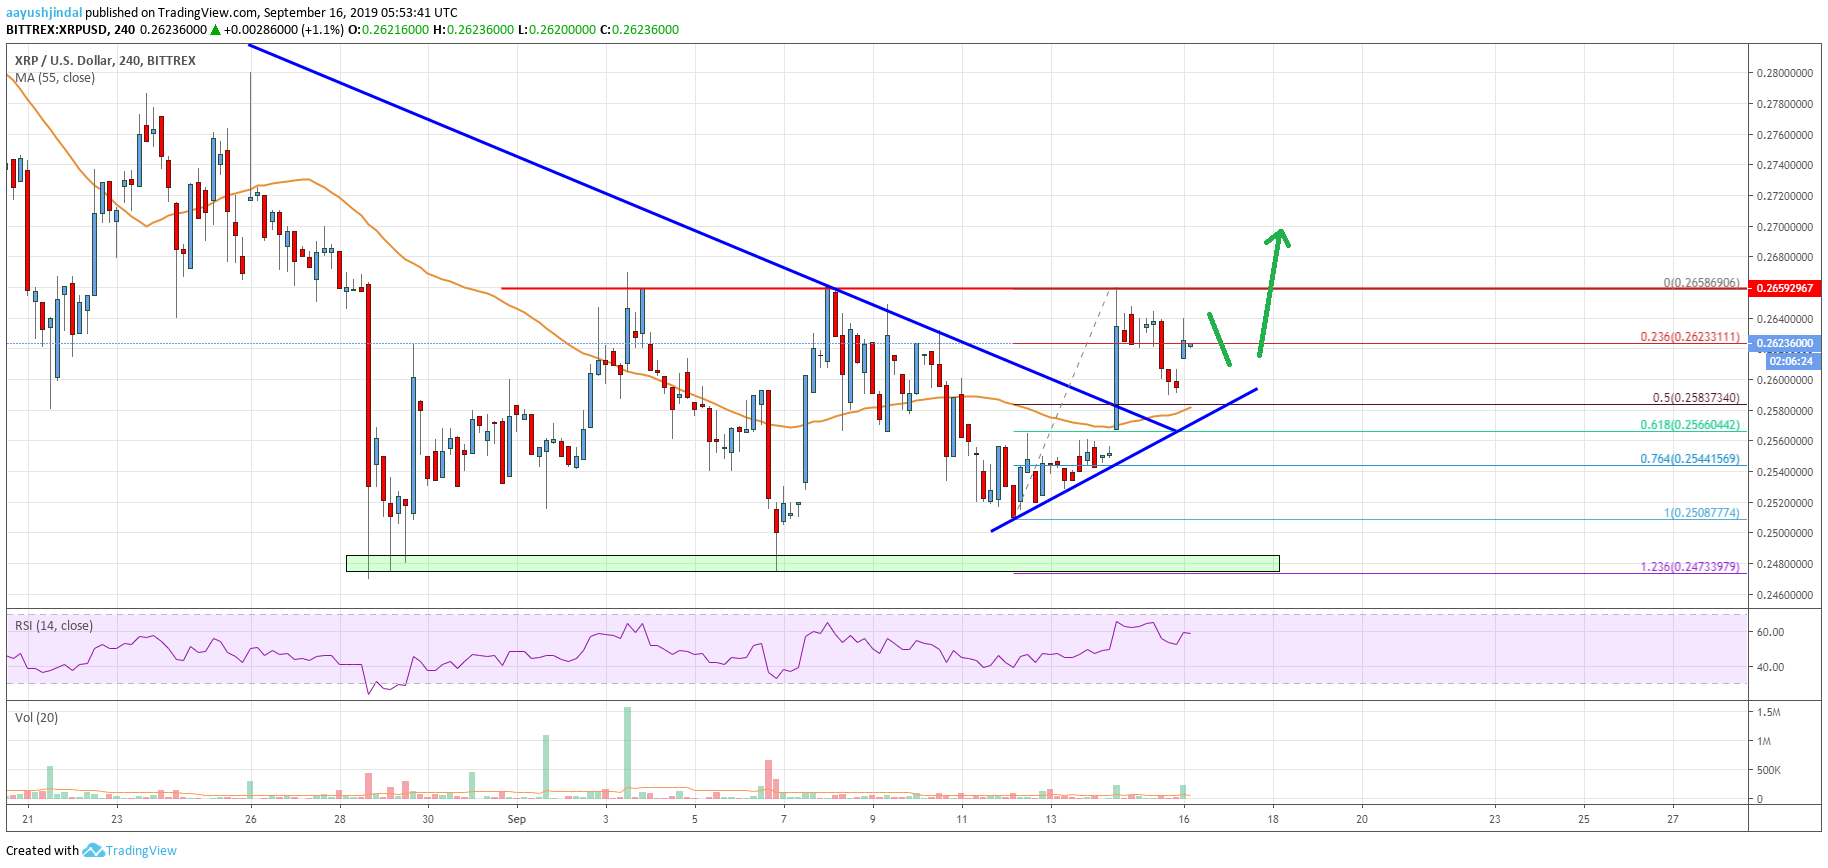
Looking at the chart, ripple price is clearly trading in a range above the $0.2580 support area. It seems like the bulls may soon make another attempt to surpass the $0.2650 resistance in the coming sessions.
Technical indicators
4 hours MACD – The MACD for XRP/USD is slowly moving into the bullish zone.
4 hours RSI (Relative Strength Index) – The RSI for XRP/USD is currently well above the 50 level.
Key Support Levels – $0.2580, $0.2550 and $0.2500.
Key Resistance Levels – $0.2650 and $0.2720.