- Ripple price climbed higher recently and settled above the $0.2900 resistance against the US dollar.
- The price is showing positive signs and it could rally further above $0.3100.
- There is a connecting resistance trend line forming with hurdle near $0.3110 on the 4-hours chart of the XRP/USD pair (data source from Bittrex).
- The price remains well bid above the $0.2880 and $0.2900 support levels in the near term.
Ripple price is trading in an uptrend above $0.2880 against the US Dollar. XRP price could continue to rise towards $0.3200 as long as it is above $0.2785.
Ripple Price Analysis
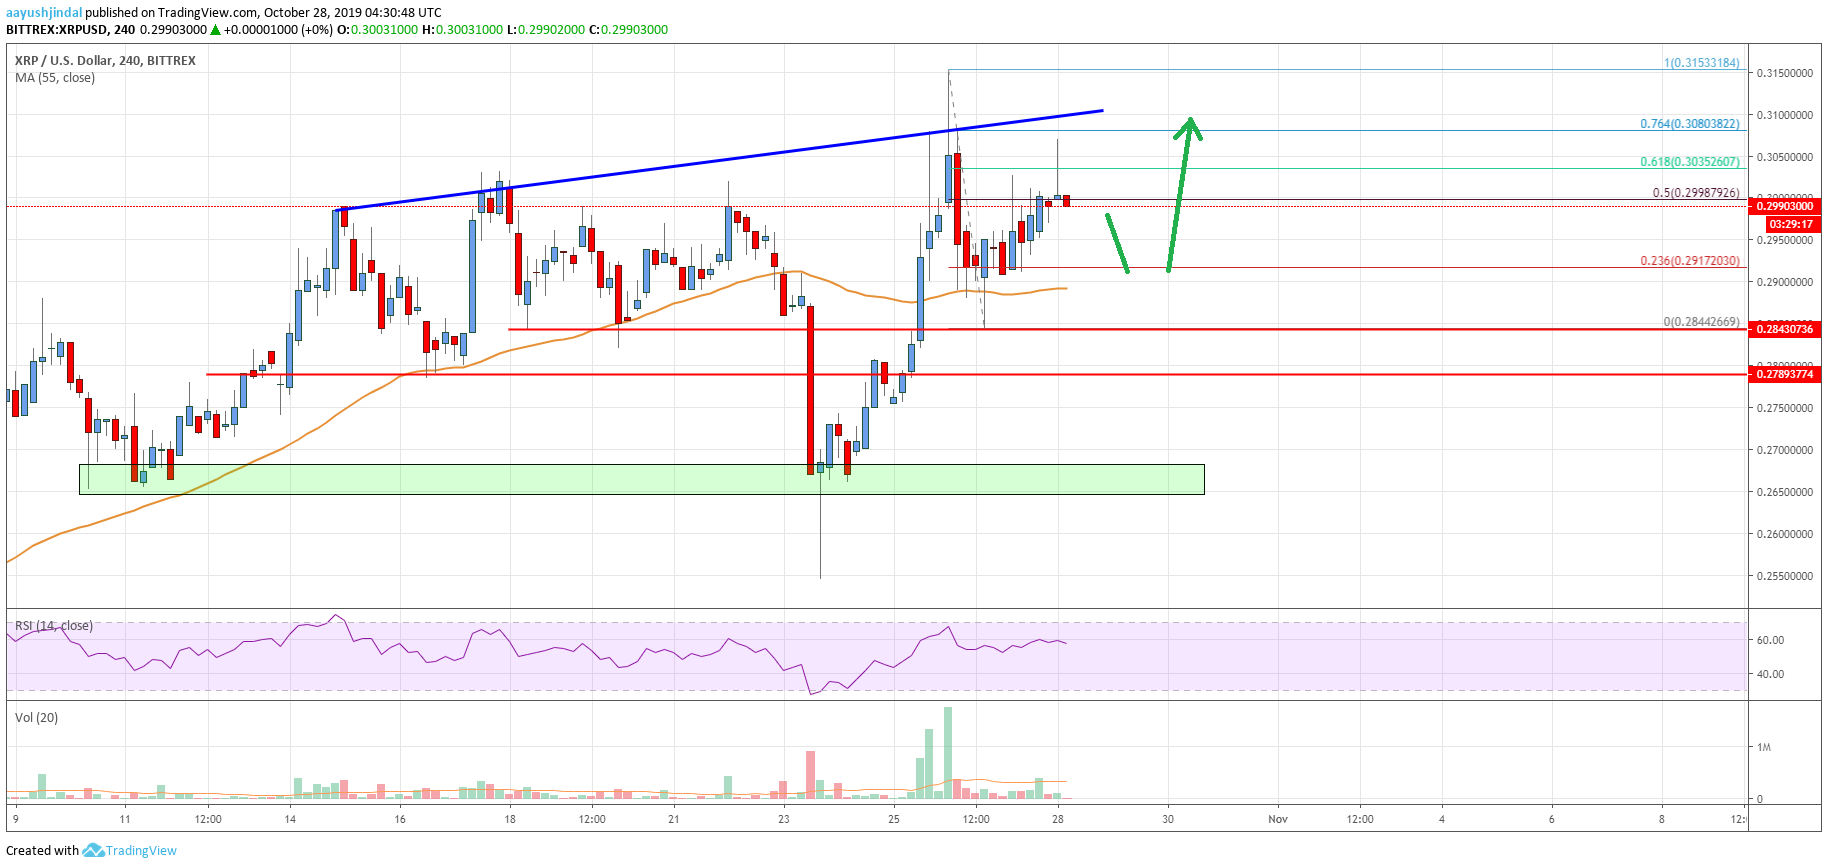
This past week, there was a decent upward move above the $0.2750 resistance in ripple price against the US Dollar. As a result, XRP price climbed above the $0.2900 resistance and settled above the 55 simple moving average (4-hours).
Finally, the price rallied above the $0.3000 and $0.3100 resistance levels. A new monthly high was formed near $0.3153 and the price recently corrected lower. It declined below $0.3000 and tested the $0.2900 support area.
However, the 55 simple moving average (4-hours) acted as a strong support area near the $0.2850 zone. A low was formed near $0.2844 and the price started a fresh increase. It broke the $0.2900 resistance, plus the 50% Fib retracement level of the downward move from the $0.3153 high to $0.2844 low.
Moreover, the price traded above the $0.3020 level, but it is struggling to continue higher. Besides, there was no close above the 61.8% Fib retracement level of the downward move from the $0.3153 high to $0.2844 low.
On the upside, there are many hurdles forming near $0.3050 and $0.3100. Additionally, there is a connecting resistance trend line forming with hurdle near $0.3110 on the 4-hours chart of the XRP/USD pair.
Therefore, ripple price must break the $0.3050 and $0.3100 resistance levels to continue higher. In the mentioned case, the price is likely to gain momentum above the $0.3150 and $0.3200 resistance levels.
Conversely, there could be a downside correction towards the $0.2950 level. The main support is near the $0.2900 level and the 55 SMA. If there is a downside break below $0.2900, the price may perhaps test the $0.2840 support area.

Looking at the chart, ripple price is clearly trading in a nice uptrend above the $0.2840 and $0.2900 support levels. Only if there is a close below the $0.2780 support area, the price might move into a downtrend.
Technical indicators
4 hours MACD – The MACD for XRP/USD is slowly gaining momentum in the bullish zone.
4 hours RSI (Relative Strength Index) – The RSI for XRP/USD is well above the 50 level.
Key Support Levels – $0.2950, $0.2900 and $0.2840.
Key Resistance Levels – $0.3050 and $0.3100.


Leave a Reply
You must be logged in to post a comment.