
- Ripple price started a fresh increase above the key $0.2660 resistance against the US dollar.
- The price is currently showing a lot of positive signs above the $0.2800 resistance area.
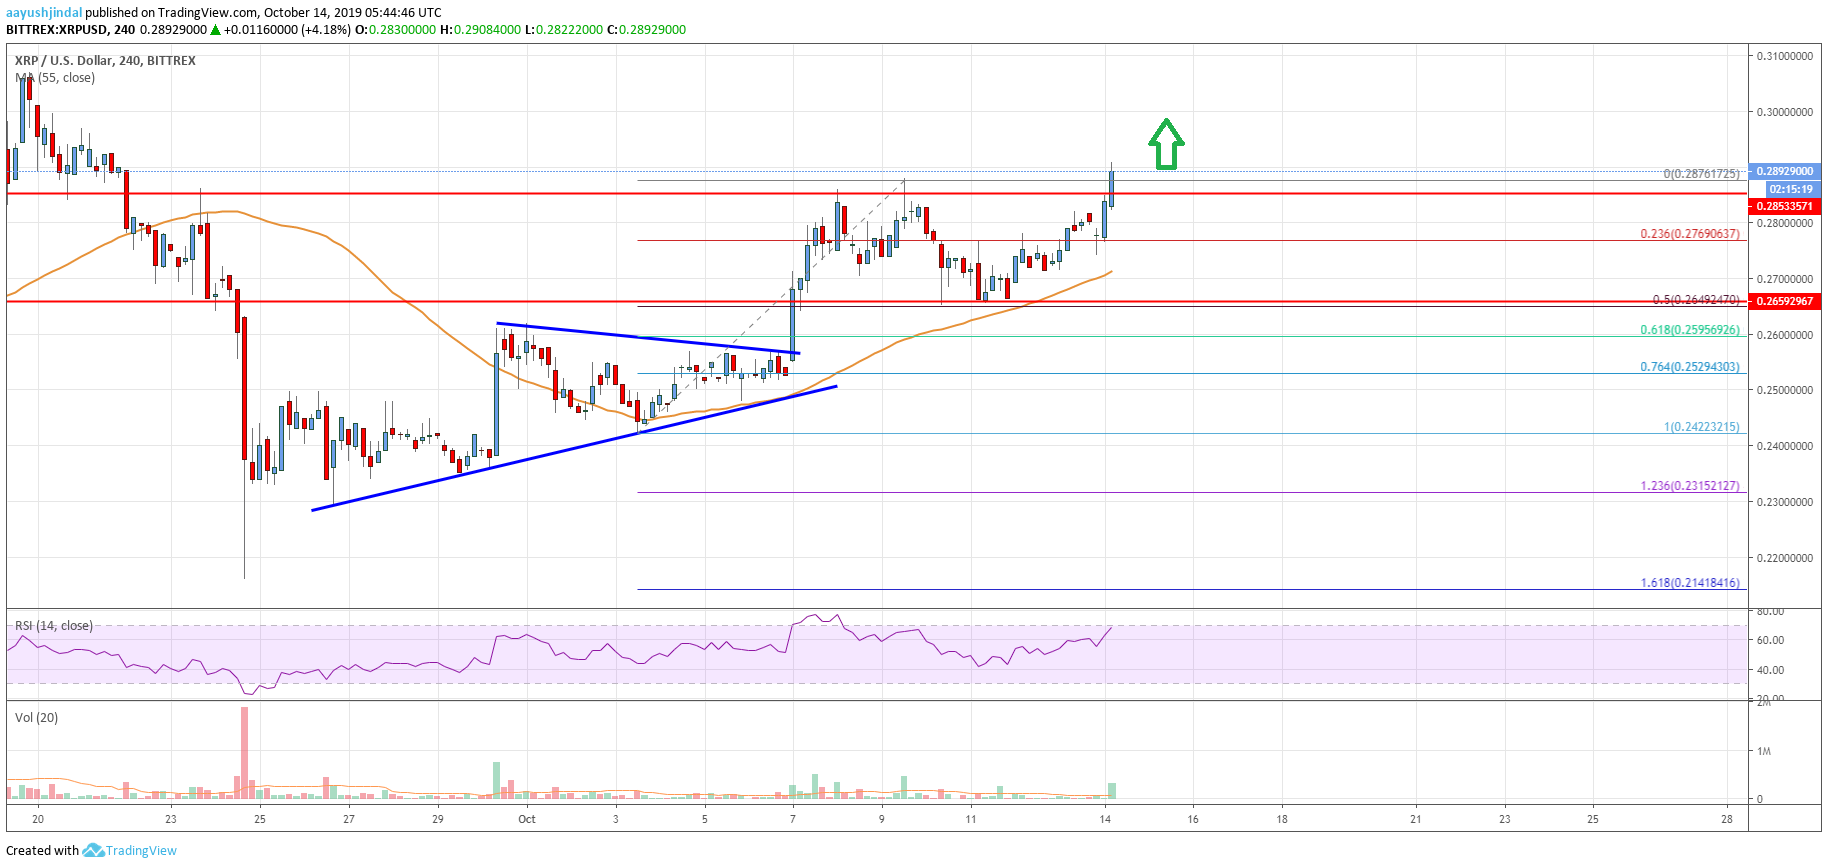
- There was a break above a major contracting triangle with resistance near $0.2580 on the 4-hours chart of the XRP/USD pair (data source from Bittrex).
- The price is likely to climb further higher towards the $0.3000 and $0.3200 resistances.
Ripple price is gaining bullish momentum above $0.2800 against the US Dollar. XRP price remains well supported and it could rise steadily towards $0.3000 or $0.3200.
Ripple Price Analysis
This past week, there was a support base formed above the $0.2450 level in ripple price against the US Dollar. As a result, XRP price started a fresh increase above the $0.2500 resistance level. Moreover, there was a close above the $0.2500 resistance level and the 55 simple moving average (4-hours). It opened the doors for more gains above the $0.2550 resistance area.
During the rise, there was a break above a major contracting triangle with resistance near $0.2580 on the 4-hours chart of the XRP/USD pair. Finally, the price broke the $0.2660 resistance area and traded towards the $0.2860 resistance area. A new monthly high was formed near $0.2876 and the price recently corrected lower (similar to bitcoin, Ethereum and bitcoin cash). It broke the $0.2750 level, plus the 23.6% Fib retracement level of the upward move from the $0.2422 low to $0.2876 high.
However, the decline was protected by the key $0.2660 support area (the previous resistance). Additionally, the 50% Fib retracement level of the upward move from the $0.2422 low to $0.2876 high provided support. More importantly, ripple price remained stable above $0.2660 and the 55 simple moving average (4-hours). As a result, the price started a fresh increase and it is currently trading nicely above $0.2850.
It seems like the price could continue to rise towards the $0.2920 resistance. The main resistance on the upside is near the $0.3000 area, above which the price could even climb towards the $0.3200 resistance. If there is a downside correction, an immediate support is near the $0.2800 level. The main supports are near $0.2760, the 55 SMA, and the $0.2660 pivot level.
Looking at the chart, ripple price is clearly trading in a positive bias above the $0.2800 level and the 55 SMA. Therefore, there are high chances of more upsides towards the $0.3000 and $0.3200 resistances in the coming days.
Technical indicators
4 hours MACD – The MACD for XRP/USD is currently gaining momentum in the bullish zone.
4 hours RSI (Relative Strength Index) – The RSI for XRP/USD is now well above the 60 level.
Key Support Levels – $0.2800, $0.2780 and $0.2660.
Key Resistance Levels – $0.2920 and $0.3000.


Leave a Reply
You must be logged in to post a comment.