- Stellar lumen price is trading in a positive zone above the $0.0600 resistance against the US Dollar.
- XLM price is showing positive signs and is testing the key $0.0640 and $0.0650 resistances.
- There is a crucial bullish trend line forming with support near $0.0610 on the 4-hours chart (data feed via Kraken).
- The pair is likely to rise sharply above the $0.0640 and $0.0650 resistance levels in the near term.
Stellar lumen price is gaining bullish momentum against the US Dollar and bitcoin. XLM price could trade further higher if it clears the $0.0650 resistance area.
Stellar Lumen Price Analysis (XLM to USD)
After testing the $0.0525 support, stellar lumen price started a decent recovery against the US Dollar. The XLM/USD pair broke a couple of important resistances near the $0.0580 and $0.0600 resistance levels to move into a bullish zone. Moreover, there was a close above the $0.0600 resistance area and the 55 simple moving average (4-hours). It opened the doors for more gains above the $0.0620 level.
The price traded as high as $0.0651 and it recently corrected lower. However, the $0.0600 support area protected declines. A low was formed near $0.0592 and the price is currently climbing higher. It traded above the $0.0620 resistance area. Additionally, there was a break above the 50% Fibonacci retracement level of the recent decline from the $0.0651 high to $0.0592 low.
At the moment, the price is trading near the $0.0640 resistance area. It seems like the 76.4% Fibonacci retracement level of the recent decline from the $0.0651 high to $0.0592 low is acting as a resistance. The main resistance is near the $0.0650 resistance area. A successful break could push the price towards the $0.0680 and $0.0700 resistance levels.
On the downside, there are many supports forming near the $0.0610 and $0.0600 levels. Moreover, there is a crucial bullish trend line forming with support near $0.0610 on the 4-hours chart. The 55 SMA is also near the $0.0610 level. Therefore, a downside break below the $0.0600 support area might start a major correction towards the $0.0580 and $0.0550 levels.
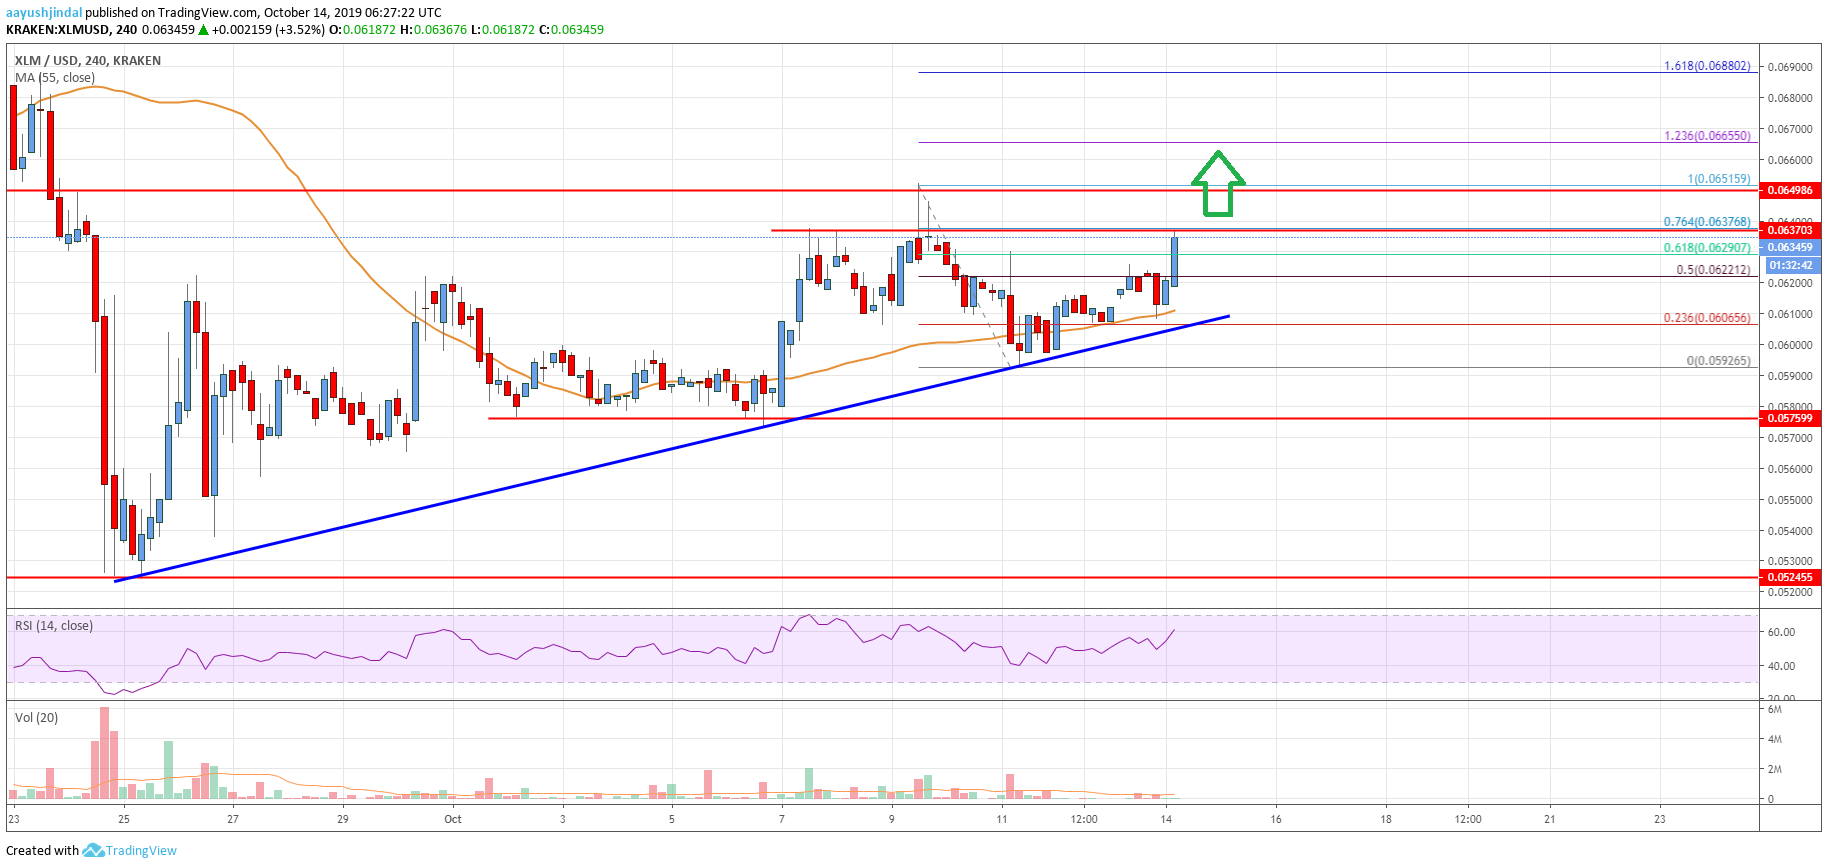
The chart indicates that XLM price is showing a lot of positive signs above the $0.0600 level. The price action is positive and suggests more gains above the $0.0650 resistance area. The next main target for the bulls may perhaps be near the $0.0700 level in the near term.
Technical Indicators
4 hours MACD – The MACD for XLM/USD is currently gaining pace in the bullish zone.
4 hours RSI – The RSI for XLM/USD is heading higher towards the 65 level.
Key Support Levels – $0.0610 and $0.0600.
Key Resistance Levels – $0.0640, $0.0650 and $0.0700.


Leave a Reply
You must be logged in to post a comment.