- Ripple price is forming a support base near the $0.2475 level against the US dollar.
- The price is currently struggling to surpass the key $0.2650 and $0.2660 resistance levels.
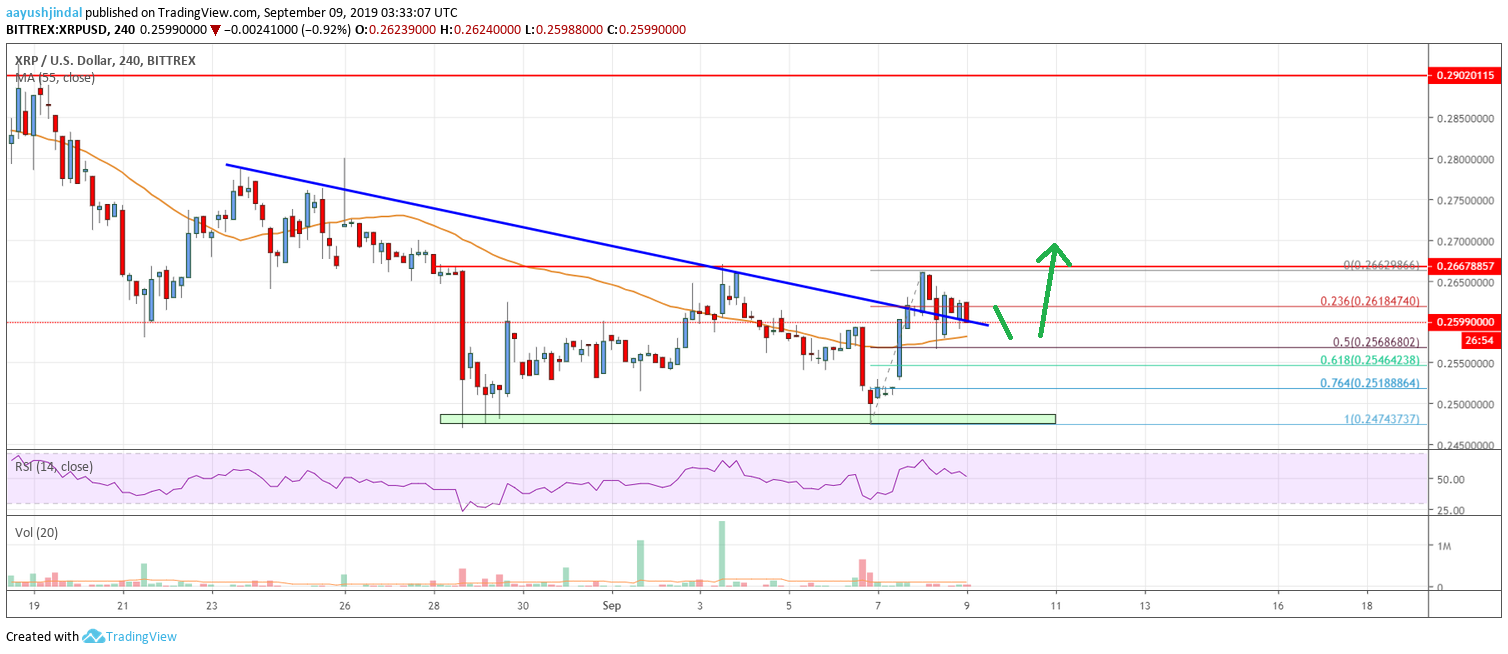
- There was a break above a major bearish trend line with resistance near $0.2615 on the 4-hours chart of the XRP/USD pair (data source from Bittrex).
- The price could start a solid upward move if it manages to break the $0.2650 and $0.2660 resistances.
Ripple price is consolidating in broad range below $0.2650 against the US Dollar. XRP price might climb higher sharply if it breaks the $0.2660 resistance zone.
Ripple Price Analysis
This past week, there was a steady rise in bitcoin, while Ethereum, bitcoin cash, ADA and ripple struggled against the US Dollar. The XRP/USD pair climbed higher above the $0.2600 resistance level. However, it failed to surpass the key $0.2650 and $0.2660 resistance levels. On the downside, the price seems to be forming a solid support base near the $0.2475 and $0.2500 levels.
The last swing low was formed near $0.2474 before the price climbed higher. It broke the $0.2600 resistance and the 55 simple moving average (4-hours). Moreover, there was a break above a major bearish trend line with resistance near $0.2615 on the 4-hours chart of the XRP/USD pair. The price traded as high as $0.2662 and it is currently correcting lower.
There was a break below the 23.6% Fib retracement level of the recent rise from the $0.2474 low to $0.2662 high. On the downside, there is a strong support forming near the $0.2560 level and the 55 SMA. Additionally, the 50% Fib retracement level of the recent rise from the $0.2474 low to $0.2662 high is also near the $0.2560 level to act as a support.
If the price fails to hold the $0.2560 and $0.2550 support levels, it could continue to decline. The next key support is near the $0.2520 level, below which the price could test the $0.2475 support area in the near term. On the upside, the $0.2650 and $0.2660 levels are important hurdles. If there is an upside break above $0.2660, the price could accelerate higher. The next stop for the bulls may be near the $0.2800 and $0.2850 levels.
Looking at the chart, ripple price is clearly showing positive signs above the $0.2550 and $0.2560 support levels. If there is a downside break below $0.2550, the price might resume its decline. Above $0.2660, the price could accelerate gains.
Technical indicators
4 hours MACD – The MACD for XRP/USD is showing a few positive signs in the bullish zone.
4 hours RSI (Relative Strength Index) – The RSI for XRP/USD is currently just above the 50 level.
Key Support Levels – $0.2560, $0.2550 and $0.25200.
Key Resistance Levels – $0.2650 and $0.2660.
