Key Highlights
- Ripple price traded lower this past week and tested the $0.3400 support against the US dollar.
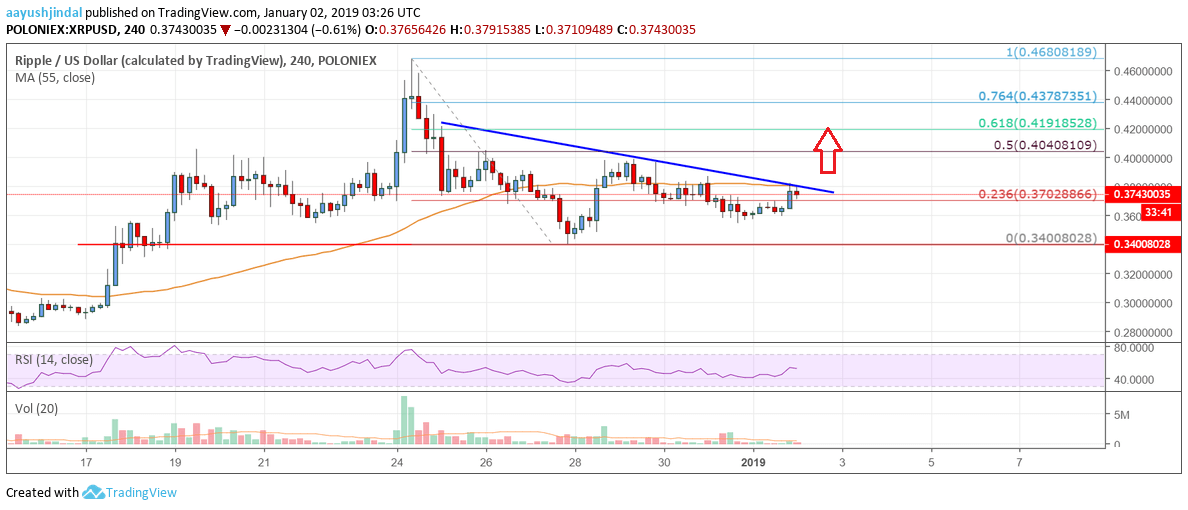
- There is a major bearish trend line in place with resistance at $0.3800 on the 4-hours chart of the XRP/USD pair (data source from Poloniex).
- The pair must break the $0.3800 resistance to start a decent upward move in the near term.
Ripple price recovered from the $0.3400 support area against the US Dollar. XRP must surpass the $0.3800 and $0.3820 resistance levels to gain bullish momentum.
Ripple Price Analysis
Recently, there was a sharp dip below the $0.3600 support in ripple price against the US Dollar. The XRP/USD pair even traded below the $0.3500 support before buyers appeared near the $0.3400 support. Besides, there was a close below the $0.3800 support and the 55 simple moving average (4-hours). A low was formed at $0.3400 and later the price started a fresh upward move.
It moved above the $0.3700 and $0.3710 resistance levels. There was also a break above the 23.6% Fib retracement level of the last decline from the $0.4680 high to $0.3400 low. At the moment, the price is struggling to gain momentum above the $0.3800 resistance and the 55 simple moving average (4-hours). More importantly, there is a major bearish trend line in place with resistance at $0.3800 on the 4-hours chart of the XRP/USD pair. Finally, the 50% Fib retracement level of the last decline from the $0.4680 high to $0.3400 low is also near the trend line.

Looking at the chart, ripple price seems to be preparing for an upside break above the $0.3800 resistance in the near term. Above $0.3800, the price may continue to move higher towards $0.4000 and $0.4200. On the downside, the main supports are $0.3500 and $0.3400.
Looking at the technical indicators:
4-hours MACD – The MACD for XRP/USD is slightly placed in the bullish zone.
4-hours RSI (Relative Strength Index) – The RSI for XRP/USD is currently above the 50 level.
Key Support Level – $0.3500
Key Resistance Level – $0.3800


Leave a Reply
You must be logged in to post a comment.