- Ripple price is facing an uphill task near the $0.2050 resistance zone against the US dollar.
- The price must break the $0.2050 resistance zone and then $0.2125 to rise steadily.
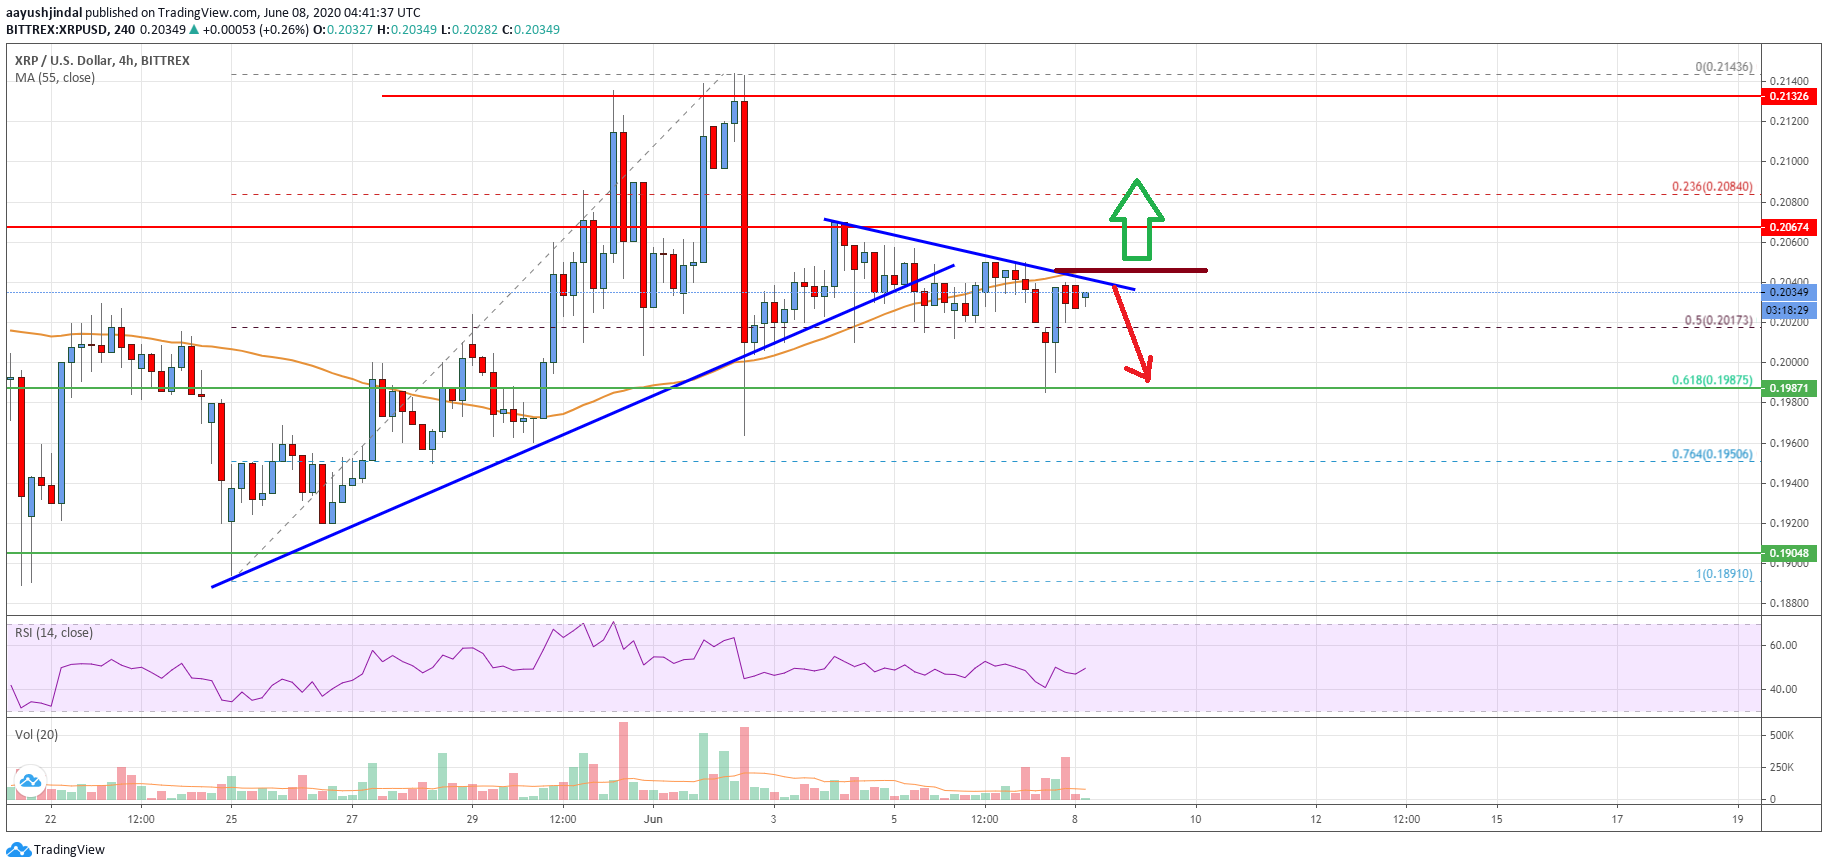
- There is a key connecting bearish trend line forming with resistance near $0.2045 on the 4-hours chart of the XRP/USD pair (data source from Bittrex).
- The pair could also start a major decline if it breaks the $0.1985 support zone.
Ripple price is approaching the next key break against the US Dollar. XRP price could either rally sharply above the $0.2050 level or it might decline heavily below $0.1985.
Ripple Price Analysis
This past week, ripple price gained traction above the $0.2000 resistance zone against the US Dollar. The XRP/USD pair even broke the $0.2100 resistance zone and the 55 simple moving average (4-hours).
However, it struggled to continue higher above the $0.2140 and $0.2150 resistance levels. A swing high was formed at $0.2143 before there was a sharp decline. The price broke the $0.2050 support and the 55 simple moving average (4-hours).
During the decline, there was a break below the 50% Fib retracement level of the upward move from the $0.1890 low to $0.2143 high. A low is formed near the $0.1985 support and the price is currently rising.
It seems like the 61.8% Fib retracement level of the upward move from the $0.1890 low to $0.2143 high acted as a strong support. Ripple price is currently approaching a major hurdle near the $0.2050 level and the 55 simple moving average (4-hours).
There is also a key connecting bearish trend line forming with resistance near $0.2045 on the 4-hours chart of the XRP/USD pair. If there is an upside break above the $0.2050 resistance, the price could start a strong rise.
The next major resistance is near the $0.2125 level, above which the price could accelerate towards $0.2200. Conversely, there is a risk of more losses below the $0.2000 and $0.1980 support levels. In the mentioned case, the price could revisit $0.1800.
Looking at the chart, ripple price is clearly trading near a major inflection point at $0.2050. Therefore, it could either start a strong rally above the $0.2050 level or it might decline heavily below $0.1985.
Technical indicators
4 hours MACD – The MACD for XRP/USD is gaining momentum in the bullish zone.
4 hours RSI (Relative Strength Index) – The RSI for XRP/USD is currently just above the 50 level.
Key Support Levels – $0.2000, $0.1985 and $0.1900.
Key Resistance Levels – $0.2050 and $0.2125.
