
SOL trades near $67.66 as weekly MACD shows bullish divergence, with $65 support and $88 resistance in focus.
Solana analysts are analysing the weekly MACD after it showed bullish divergence near a familiar wedge structure.
The signal appeared as SOL traded near lower support after recent selling pressure.
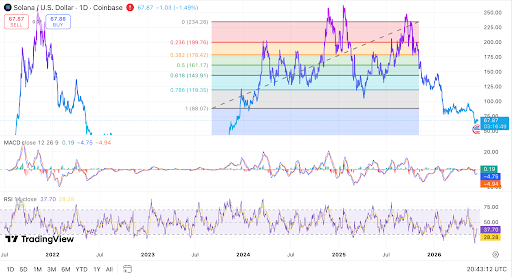
However, the daily chart still shows weakness, with SOL near $67.66 on the tradingview chart. Price remains below key recovery levels at $88.07 and $119.35.
This creates a mixed technical picture across timeframes. Weekly momentum is improving, while daily price action remains under pressure.
For now, traders are watching two key levels. The $65 area is support, while $88 remains the main recovery level.
Solana Price Trades Below Key Fibonacci Levels
Solana remains below the $88.07 Fibonacci level after losing higher support on the daily chart.
That level previously acted as an important area for buyers during recovery attempts. The move below it has kept SOL in a weaker short-term structure.
Meanwhile, SOL also trades below the 0.786 Fibonacci level near $119.35. This area now stands as a higher resistance zone if buyers regain control.
Before that happens, the price needs to move back above $88 with stronger demand. The current range places SOL closer to the $60 to $70 support area.
A hold above $65 could allow a move toward $75 and then $88. However, a break below $65 may bring $55 and $50 into focus.
Weekly MACD Divergence Returns to Focus
The main technical update comes from the weekly MACD, which has shown bullish divergence.
This setup forms when price weakens while momentum begins to improve. Traders often watch it because it can show that selling pressure is slowing.
$SOL weekly MACD just triggered a massive bullish divergence, from the exact same structural wedge breakout that previously started the historic bullrun pic.twitter.com/zu2JfJej61
— BATMAN ⚡ (@CryptosBatman) June 14, 2026
According to the chart analysis, the signal formed near a familiar wedge breakout structure.
A similar structure appeared before a previous strong Solana rally. Still, the current market needs price confirmation before the recovery view gains strength.
At the same time, the daily MACD remains weak and below the neutral area. This shows that sellers are still active on the shorter timeframe.
Therefore, traders are watching whether weekly momentum can support stronger daily movement.
Read Also:
Solana Buy Signal Flashes: SOL Price Could Blast Toward $77 Resistance Next
Buyers Need $88 Breakout to Shift Structure
The $88 level remains the main recovery line for Solana in the near term. A daily close above this level would show that buyers are regaining control.
It would also reduce pressure from the recent breakdown below former support. The RSI is near 37, showing that momentum remains below the midline.
This means buyers have not yet taken full control on the daily chart. A move above 50 would show improving demand from the market.
If SOL breaks above $88, attention may shift toward $119.35. That level marks the next clear Fibonacci resistance area on the chart.
Until then, SOL remains between lower support and overhead resistance. For now, Solana shows weekly recovery signals while the daily chart remains weak.
The bullish divergence has placed the wedge breakout back in focus. However, confirmation still depends on support at $65 and resistance at $88.


Leave a Reply
You must be logged in to post a comment.