- Solana price extended decline below the $50 support against the US Dollar.
- The price is now trading below $50 and the 55 simple moving average (4-hours).
- There is a key bearish trend line forming with resistance near $48.20 on the 4-hours chart of the SOL/USD pair (data feed from Coinbase).
- The pair must clear $48 and $50 to start a fresh recovery wave in the near term.
Solano price is struggling below $50 against the US Dollar, similar to bitcoin. SOL could decline sharply if there is a clear move below the $40 support.
Solana (SOL) Price Analysis
SOL price remained in a bearish zone below the $65 and $60 levels. There was another decline and the price traded below the $55 support zone.
The pair settled below the $50 support zone and the 55 simple moving average (4-hours). It even spiked below the $40 level and traded as low as $39.93. It is now consolidating losses and trading above $42. There was a break above the 23.6% Fib retracement level of the downward move from the $59 swing high to $39 low.
On the upside, an immediate resistance is near the $48.00 level. There is also a key bearish trend line forming with resistance near $48.20 on the 4-hours chart of the SOL/USD pair.
The next major resistance is near the $50 level. It is close to the 50% Fib retracement level of the downward move from the $59 swing high to $39 low. Any more gains might send sol price towards the $55 resistance zone. The next major resistance sits near the $60 level.
On the downside, an initial support is near the $42 level. The next key support is near the $40 level. A downside break below the $40 support level might spark a sharp decline. In the stated case, the price may perhaps decline towards the $32 level. Any more losses might call for a test of $30.
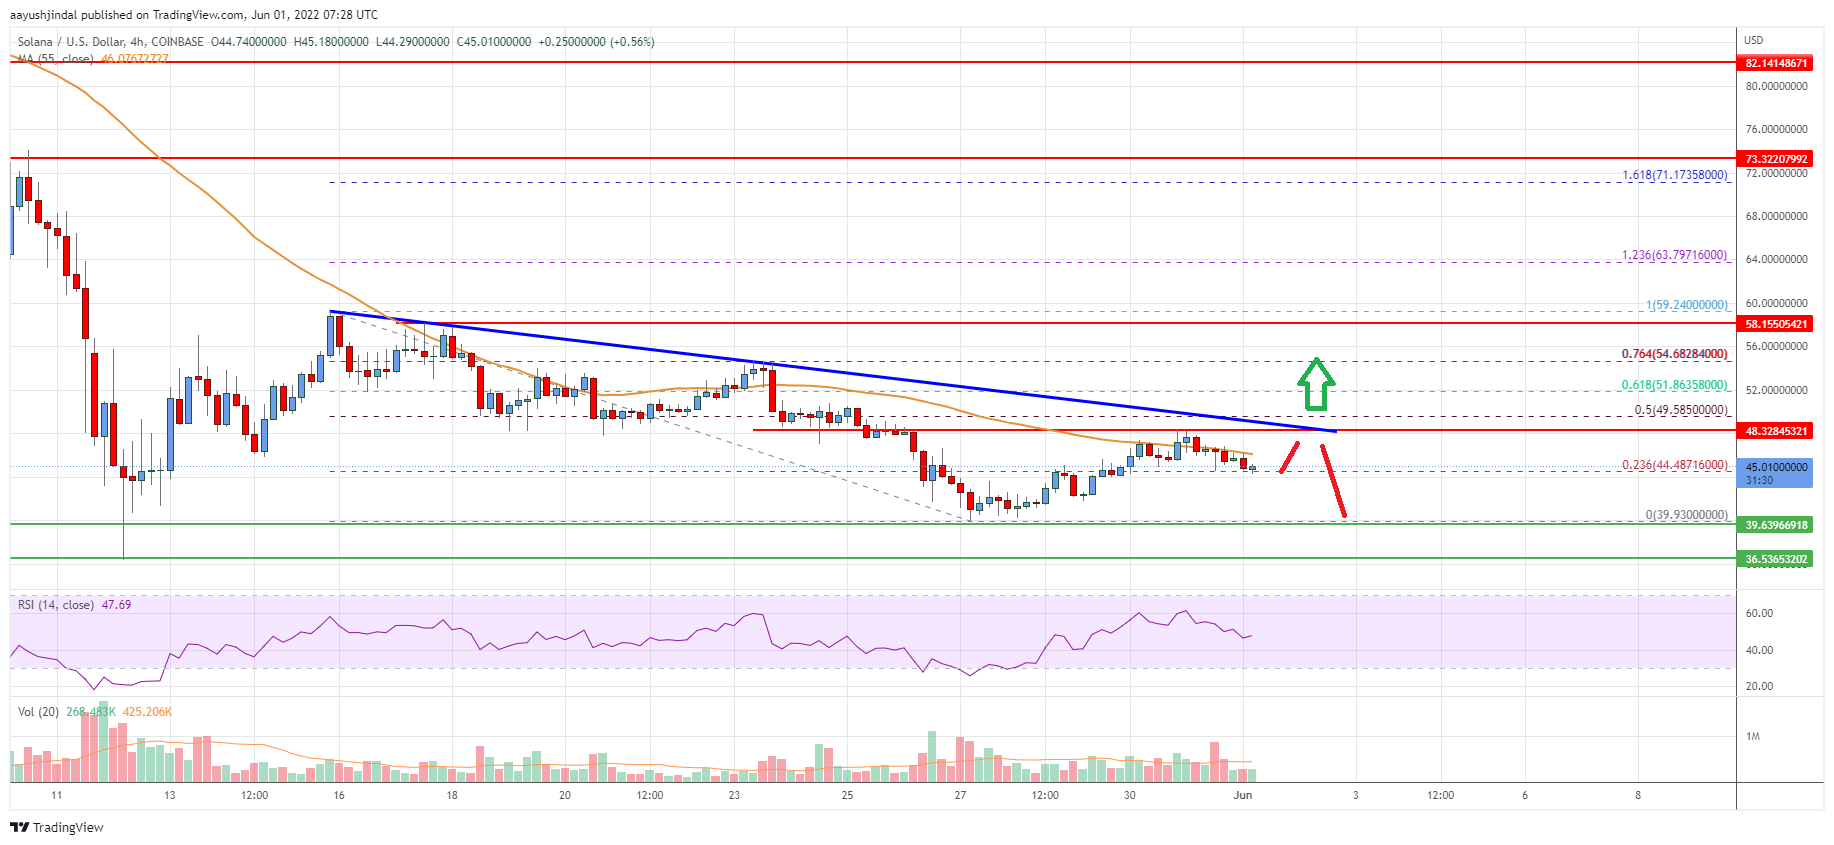
Looking at the chart, solana price is clearly trading below $50.00 and the 55 simple moving average (4-hours). Overall, the price must clear $48 and $50 to start a fresh recovery wave in the near term.
Technical Indicators
4 hours MACD – The MACD is now losing momentum in the bullish zone.
4 hours RSI (Relative Strength Index) – The RSI is now near the 50 level.
Key Support Levels – $42.00 and $40.00.
Key Resistance Levels – $48,20, $50.00 and $60.00.


Leave a Reply
You must be logged in to post a comment.