- Solana price started a fresh increase above the $110.00 level against the US Dollar.
- The price is now trading above $110.00 and the 55 simple moving average (4-hours).
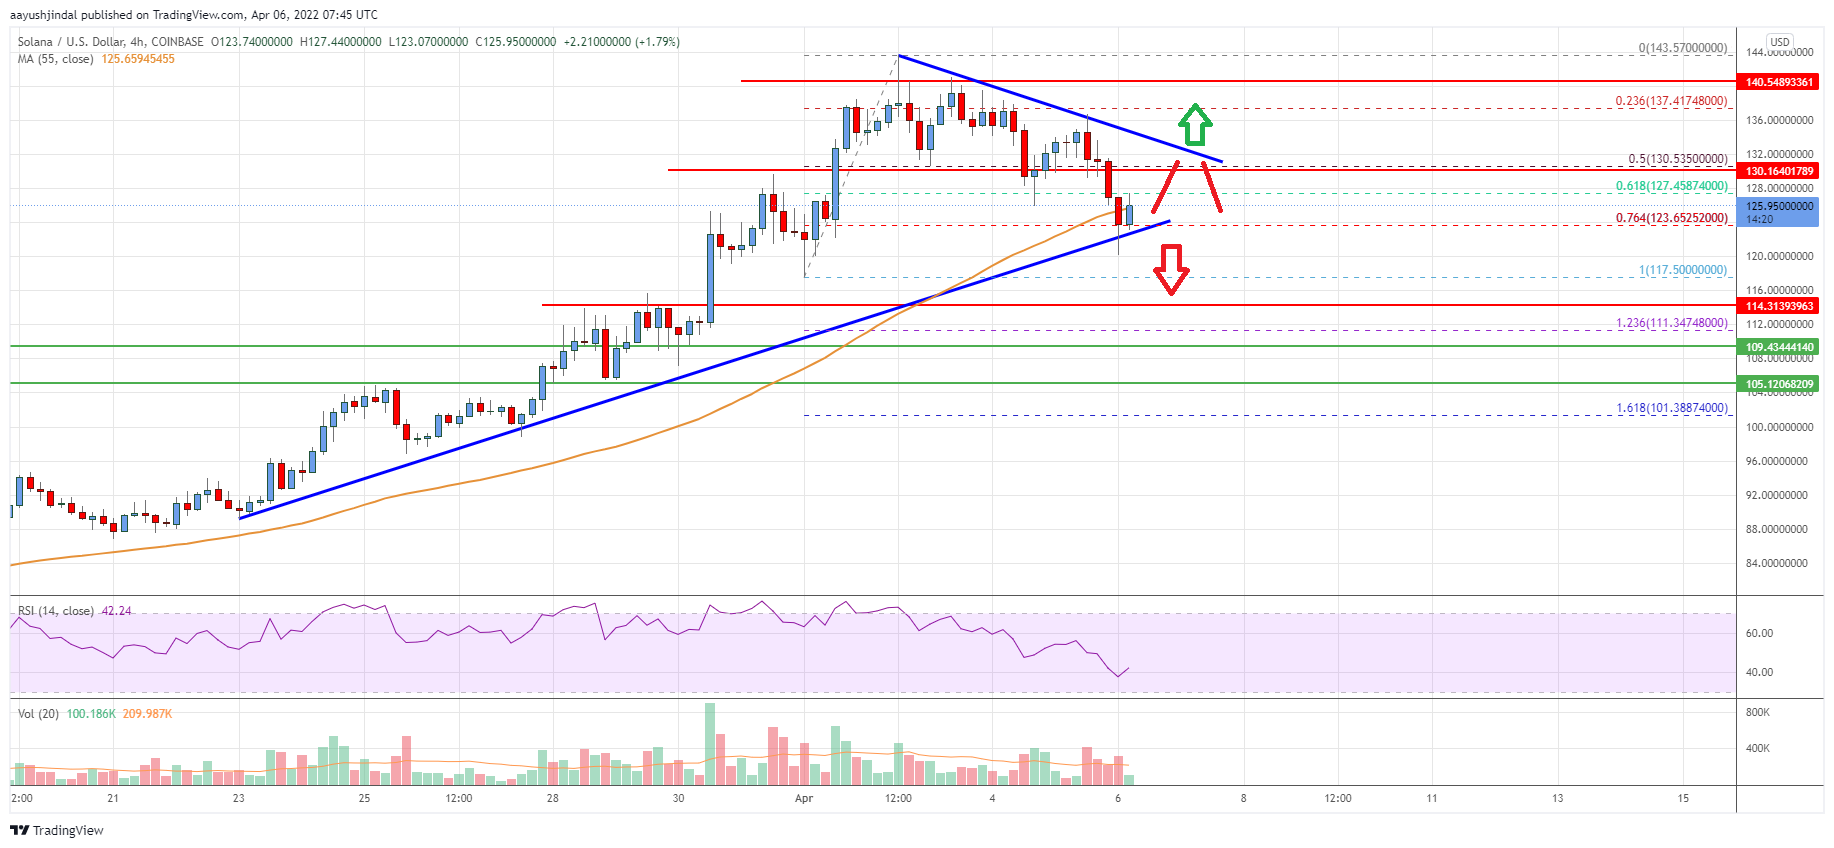
- There is a major contracting triangle forming with support near $123 on the 4-hours chart of the SOL/USD pair (data feed from Coinbase).
- The pair must clear $132 to continue higher in the near term.
Solano price is losing pace above $120 against the US Dollar, similar to bitcoin. SOL could extend decline if it settles below the $120 support.
Solana (SOL) Price Analysis
SOL price formed a base above the $100.00 level. As a result, it started a decent increase and broke many hurdles near the $110.00 level.
The price even climbed above the $120.00 resistance and the 55 simple moving average (4-hours). There was a move $132 level and the price traded as high as $143.57. Recently, there was a downside correction below the $135 and $132 levels.
The price declined below the 50% Fib retracement level of the upward move from the 117.50 swing low to $143.57 high. It is now consolidating near the $124 support zone.
It is also testing the 76.4% Fib retracement level of the upward move from the 117.50 swing low to $143.57 high. There is also a major contracting triangle forming with support near $123 on the 4-hours chart of the SOL/USD pair.
The next key support is near the $120.00 level. A downside break below the $120 support level might spark a sharp decline. In the stated case, the price may perhaps decline towards the $105 level.
On the upside, an immediate resistance is near the $130.00 level. The next major resistance on the upside is near the $132.00 level. To start another increase, the price must settle above the $132.00 level in the near term. The next major resistance could be $140.00, above which the price could rise to $150.00.

Looking at the chart, solana price is clearly trading above $110.00 and the 55 simple moving average (4-hours). Overall, the price must clear $132 to continue higher in the near term.
Technical Indicators
4 hours MACD – The MACD is now gaining momentum in the bearish zone.
4 hours RSI (Relative Strength Index) – The RSI is now just below the 50 level.
Key Support Levels – $123.00 and $120.00.
Key Resistance Levels – $130.00, $132.00 and $140.00.


Leave a Reply
You must be logged in to post a comment.