- Solana price gained bearish momentum below the $150 level against the US Dollar.
- The price is now trading below $150 and the 55 simple moving average (4 hours).
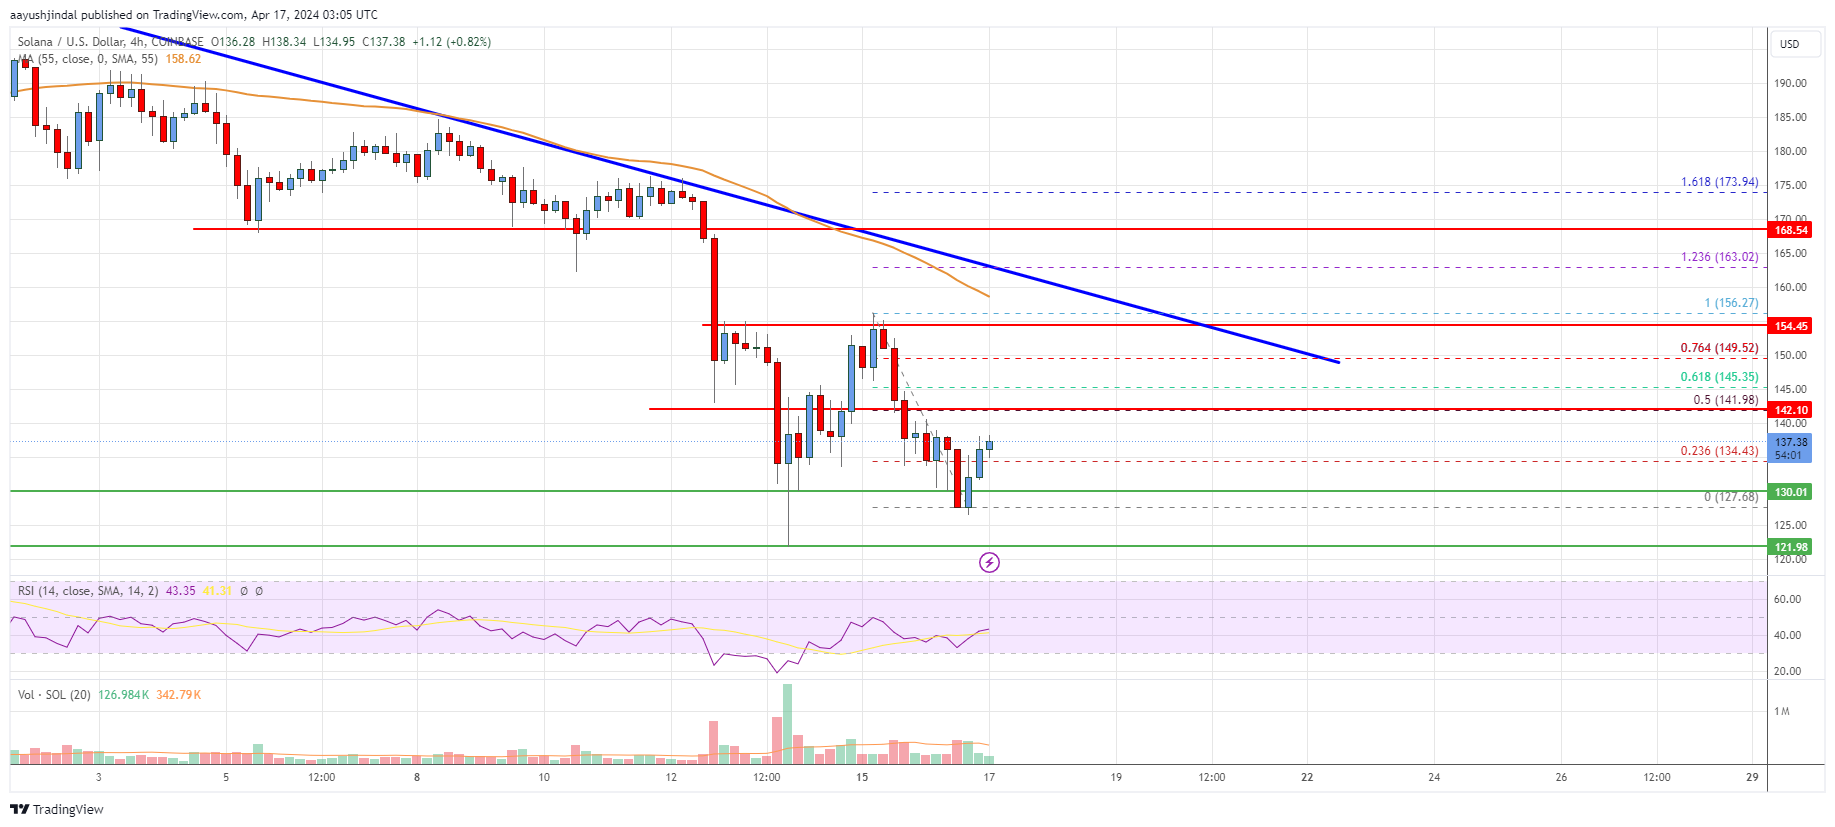
- There is a key bearish trend line forming with resistance near $155 on the 4-hour chart of the SOL/USD pair (data feed from Coinbase).
- The pair could recover, but the upsides might be limited above the $150 resistance.
Solana price is trading in a bearish zone below $160 against the US Dollar, like Bitcoin. SOL could extend losses if it stays below the $150 resistance zone.
Solana (SOL) Price Analysis
SOL price started a fresh decline below the $180 support zone. The price gained bearish momentum below the $162 support zone. The bears were able to push the price below the $155 and $150 support levels.
The recent low was formed near $127.68 and the price is now consolidating losses. It seems like the price might attempt a recovery wave above the $135 level or the 23.6% Fib retracement level of the downward move from the $156.27 swing high to the $127.68 low.
On the upside, immediate resistance is near the $142 level or the 50% Fib retracement level of the downward move from the $156.27 swing high to the $127.68 low.
The next major resistance is near the $150 level. There is also a key bearish trend line forming with resistance near $155 on the 4-hour chart of the SOL/USD pair. A clear move above the $155 resistance level might call for a steady increase.
The next major resistance sits near the $162 level, above which the price might rise toward $180. Any more gains might send SOL price toward the $200 resistance zone.
On the downside, initial support is near the $130 level. A downside break below the $130 support level might spark a major drop. In the stated case, the price may perhaps decline toward the $115 level.

Looking at the chart, Solana price is trading below $150 and the 55 simple moving average (4 hours). Overall, the price could recover, but the upsides might be limited above the $150 resistance.
Technical Indicators
4 hours MACD – The MACD is now gaining momentum in the bearish zone.
4 hours RSI (Relative Strength Index) – The RSI is now below the 50 level.
Key Support Levels – $130 and $121.
Key Resistance Levels – $142, $150, and $155.