
XLM retests $0.179 resistance for a fourth time as price trades in a channel, with $0.22 as the next target on a breakout.
Stellar Lumens (XLM) is moving toward a key price area again, and traders are watching the daily chart closely.
XLM has stayed inside a clear trading channel since February, and the $0.179 level has capped each recovery attempt.
Now, with a fourth test underway, market attention is turning to whether that ceiling can finally break and open the way toward $0.22.
XLM Nears Key Resistance After Months Inside a Channel
Since February, XLM has traded inside a defined range, with price swings moving between support near $0.147 and resistance near $0.179.
Each move into the upper band has led to selling pressure, and each pullback has found buyers near the lower end of the structure. This pattern has shaped the current market setup.
The latest move has brought XLM back toward the upper boundary once again.
At the time of the chart reading, price was near $0.1694, which placed it in the upper half of the range.
The broader chart still showed a larger downtrend, but short-term price action pointed to improving stability.
$0.179 is the main level to watch for Stellar $XLM.
Stellar has been locked in a well-defined channel since February. For months, the script has remained the same: a rejection at $0.179 followed by a retreat to the $0.147 support.
We are currently approaching the $0.179… pic.twitter.com/dG5DpQ3RnJ
— Ali Charts (@alicharts) April 18, 2026
Market observers often watch repeated tests of one level because they can change how supply behaves.
In this case, the $0.179 area has been tested several times in recent months.
One market view stated, “The more a level is tested, the weaker it becomes.” That idea has added to interest around the current setup.
Price Structure Shows Pressure Building Beneath $0.179
The daily chart showed that XLM dropped sharply earlier from the $0.23 to $0.24 zone.
After that fall, prices formed a base between $0.135 and $0.145. From there, the asset entered a sideways recovery phase, and that phase has now continued for weeks.
Recent candles suggest that sellers have lost some control, while buyers have become more active on dips.
Higher lows have started to appear on the right side of the chart, and that often signals growing support. At the same time, resistance has remained firm near $0.175 to $0.179.
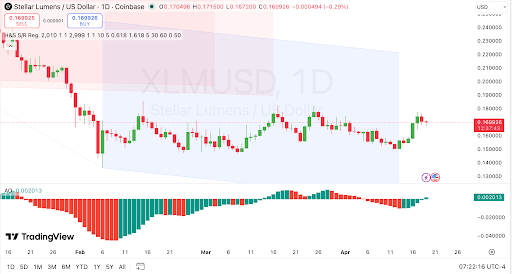
This area now stands as the main short-term barrier. A daily close above $0.179 would place price beyond the repeated rejection zone.
If that happens, the next resistance levels sit around $0.180 to $0.185, then near $0.195 to $0.200.
Support remains visible at several lower zones. The first area sits near $0.167 to $0.169, and the next lies around $0.160 to $0.162.
Below that, stronger support remains near $0.152 to $0.155, while the February low near $0.135 to $0.140 remains the major floor.
Read Also:
Stellar XLM Holds Key Long-Term Support as Traders Watch for a Move Toward $0.53
Momentum Improves as Traders Watch for Breakout Confirmation
The chart’s momentum indicator, which appears to be the Awesome Oscillator, has moved from deeply negative readings to slightly positive territory.
The latest reading near 0.0020 suggests that downside momentum has faded, and short-term buying strength is building.
Green histogram bars have returned, and that points to improving market energy.
Still, the reading remains modest, so traders may look for stronger follow-through before treating the move as a full trend shift.
Momentum is improving, but confirmation is still needed. A breakout case would depend on a clean daily close above $0.179.
That could support a move toward $0.22, which would mark a gain of about 20% from the breakout zone.
Until then, XLM remains inside a known channel, and traders are likely to track whether resistance holds or gives way. For now, the chart shows a market at a decision point.
XLM is pressing against a level that has stopped several rallies, and the repeated retests have kept focus on whether supply at that ceiling is close to exhaustion.


Leave a Reply
You must be logged in to post a comment.