
- Stellar lumen price is facing a lot of hurdles near $0.0735 and $0.0750 against the US Dollar.
- XLM price is currently declining and it could revisit the $0.0670 support area.
- There was a break below a key contracting triangle with support near $0.0712 on the 4-hours chart (data feed via Kraken).
- The pair must climb above $0.0735 and $0.0750 to start a strong increase in the near term.
Stellar lumen price is facing many resistances against the US Dollar and bitcoin. XLM could decline towards the $0.0650 support before a fresh increase.
Stellar Lumen Price Analysis (XLM to USD)
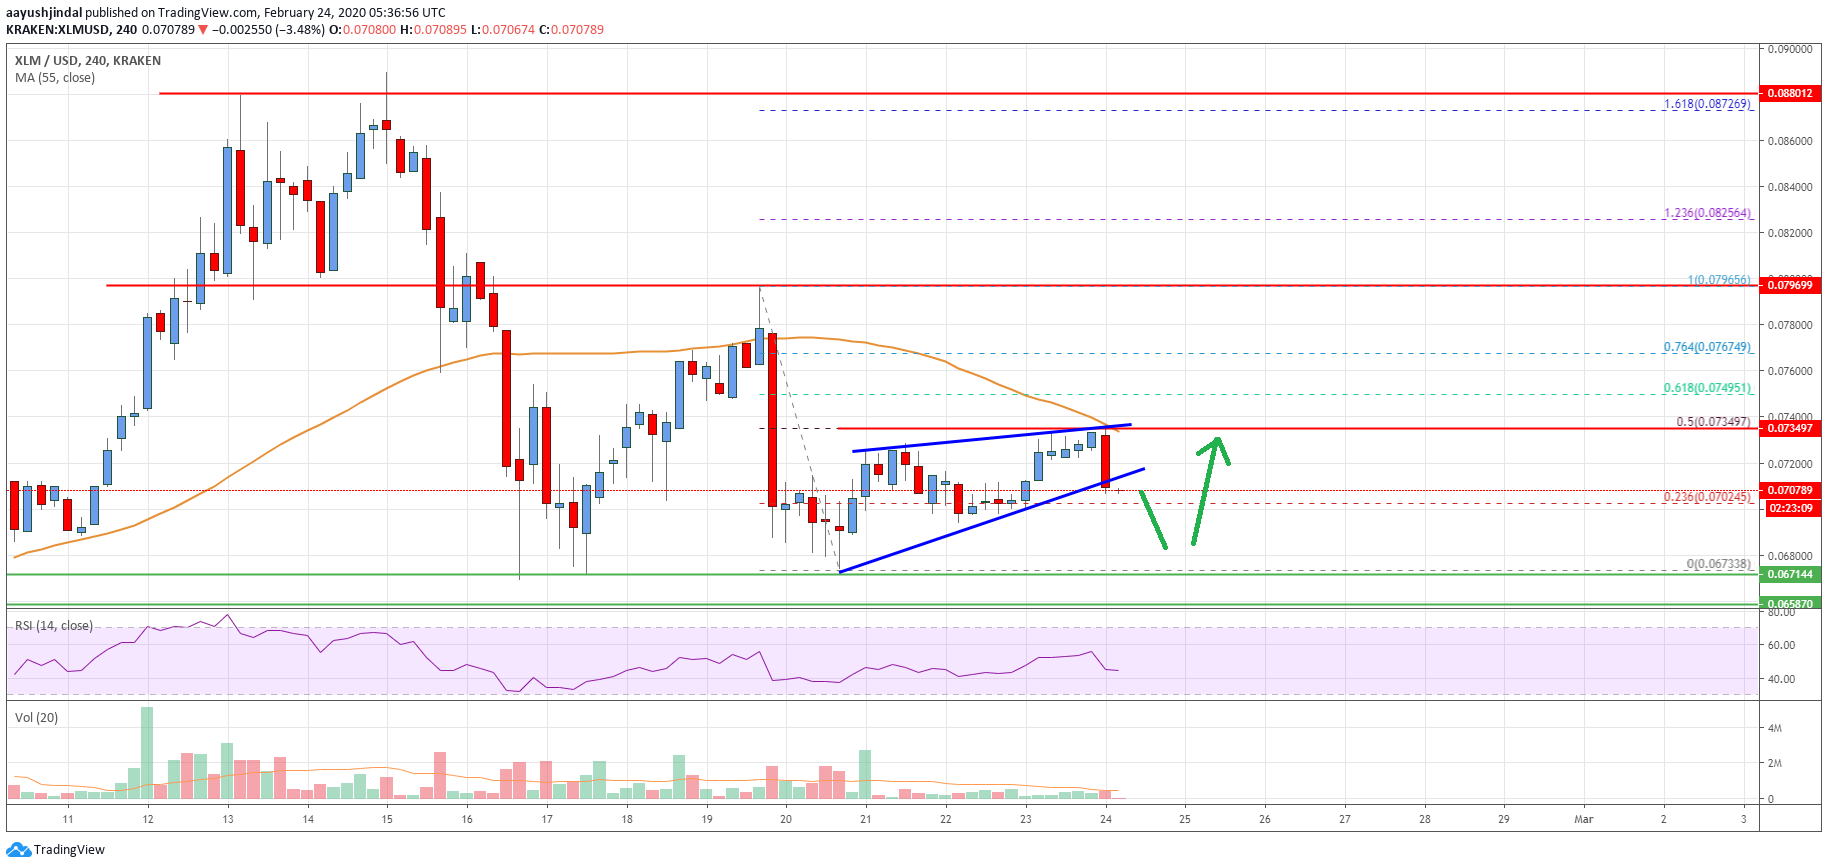
After a failed attempt near the $0.0800 area, stellar lumen price declined sharply below $0.0780 and $0.0750 against the US Dollar. The XLM/USD pair tested the $0.0680 support area and recently recovered higher.
There was a break above the $0.0700 and $0.0720 resistance levels. Besides, the price surpassed the 23.6% Fibonacci retracement level of the recent slide from the $0.0796 high to $0.0673 low.
However, the upward move was capped by the $0.0735 level and the 55 simple moving average (4-hours). The 50% Fibonacci retracement level of the recent slide from the $0.0796 high to $0.0673 low also acted as a hurdle.
Clearly, the price failed to continue above $0.0735 and it is currently declining. There was a break below a key contracting triangle with support near $0.0712 on the 4-hours chart.
The pair is currently declining and trading below the $0.0720 level. An initial support is near the $0.0700 level. The first key support is near the $0.0680 level. The next major support is near the $0.0655 area, below which there is a risk of a sharp decline in the coming sessions.
Conversely, the price could climb back above the $0.0720 and $0.0735 levels. Having said that, stellar lumen price must settle above the $0.0750 level and the 55 simple moving average (4-hours) to continue higher.
In the mentioned case, the price could surge towards the $0.0795 and $0.0800 resistance levels. Any further gains could lead the price towards the $0.0820 resistance area.
The chart indicates that XLM price is showing a few bearish signs below the $0.0735 and $0.0750 resistance levels. However, as long as the $0.0650 support is intact, there are chances of a fresh increase in the near term.
Technical Indicators
4 hours MACD – The MACD for XLM/USD is currently moving in the bearish zone.
4 hours RSI – The RSI for XLM/USD is now just below the 50 level.
Key Support Levels – $0.0680 and $0.0650.
Key Resistance Levels – $0.0735, $0.0750 and $0.0800.


Leave a Reply
You must be logged in to post a comment.