- Stellar lumen price is showing bearish signs below the $0.085 resistance zone against the US Dollar.
- XLM price is now trading below $0.0850 and the 55 simple moving average (4-hours).
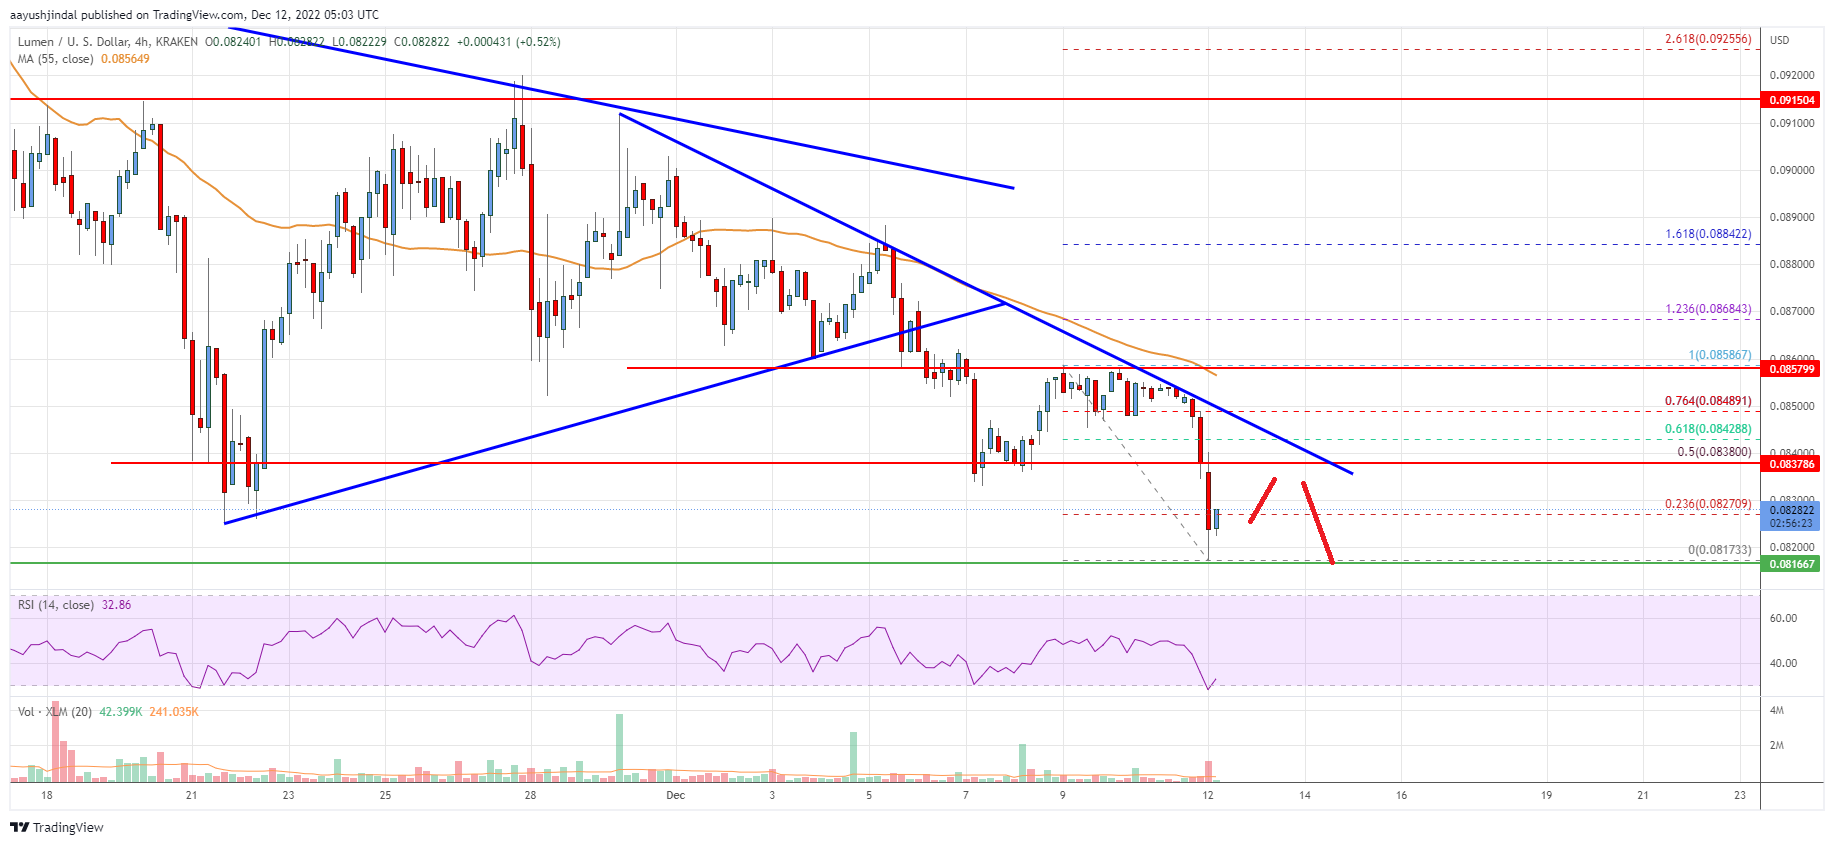
- There is a major bearish trend line forming with resistance near $0.0835 on the 4-hours chart (data feed via Kraken).
- The pair could accelerate lower unless there is a clear move above $0.085 and $0.090.
Stellar lumen price is trading below $0.0900 against the US Dollar, similar to bitcoin. XLM price must stay above the $0.080 support to avoid more losses.
Stellar Lumen Price Analysis (XLM to USD)
After a minor upside correction, stellar lumen price faced sellers near the $0.0900 zone against the US Dollar. The XLM/USD pair formed a high near $0.0888 before it started a fresh decline.
There was a move below the $0.0850 and $0.0835 levels. The price even settled below the $0.088 level and the 55 simple moving average (4-hours). A low was formed near $0.0817 and the price is now consolidating losses. There was a minor move above the $0.0820 level.
It is testing the 23.6% Fib retracement level of the recent decline from the $0.0856 swing high to $0.0817 low. On the upside, the price is facing resistance near the $0.0835 level.
There is also a major bearish trend line forming with resistance near $0.0835 on the 4-hours chart. The trend line is near the 50% Fib retracement level of the recent decline from the $0.0856 swing high to $0.0817 low. The next hurdle could be near the $0.0850 zone.
A clear move above the $0.085 level might send the price towards the $0.0900 level. Any more gains could lead the price towards the $0.0980 level or even $0.1000.
An initial support on the downside is near the $0.0818 level. The main support is near the $0.0800 zone. Any more losses could lead the price towards the $0.0765 level in the near term, below which the price might even retest $0.0750.

The chart indicates that XLM price is now trading below $0.0900 and the 55 simple moving average (4-hours). Overall, the price could accelerate lower unless there is a clear move above $0.085 and $0.090.
Technical Indicators
4 hours MACD – The MACD for XLM/USD is gaining momentum in the bearish zone.
4 hours RSI – The RSI for XLM/USD is now below the 50 level.
Key Support Levels – $0.0818 and $0.0800.
Key Resistance Levels – $0.0835, $0.0850 and $0.0900.


Leave a Reply
You must be logged in to post a comment.