
- Stellar lumen price is facing resistance near $0.4200 and $0.4500 against the US Dollar.
- XLM price is now consolidating below $0.4000 and the 55 simple moving average (4-hours).
- There is a key bearish trend line forming with resistance near $0.4060 on the 4-hours chart (data feed via Kraken).
- The pair could start a strong increase if it manages to clear $0.4060 and $0.4200.
Stellar lumen price is forming a base above the $0.3750 level against the US Dollar, while bitcoin is rising. XLM price could start a fresh increase once it clears the $0.4200 resistance.
Stellar Lumen Price Analysis (XLM to USD)
There was a fresh decline in stellar lumen price from the $0.4350 resistance zone against the US Dollar. The XLM/USD pair broke the $0.4000 support level and the 55 simple moving average (4-hours).
It even spiked below the $0.3800 support level and tested the $0.3750. The recent swing low was formed near $0.3761 before the price corrected higher. There was a break above the $0.3900 and $0.3920 resistance levels.
There was also a break above the 50% Fibonacci retracement level of the downward move from the $0.4348 swing high to $0.3761 low. However, the price failed to gain strength above the $0.4100 level. There is also a key bearish trend line forming with resistance near $0.4060 on the 4-hours chart.
The trend line is close to the 61.8% Fibonacci retracement level of the downward move from the $0.4348 swing high to $0.3761 low. A clear break above the trend line, the 55 simple moving average (4-hours), and $0.4200 is must to start a strong increase. The next major resistance is near the $0.4500 level.
If there is no upside break, the price could move down below $0.3900. The first key support is near the $0.3800. The main support sits at $0.3750, below which the price could dive towards the $0.3540 level.
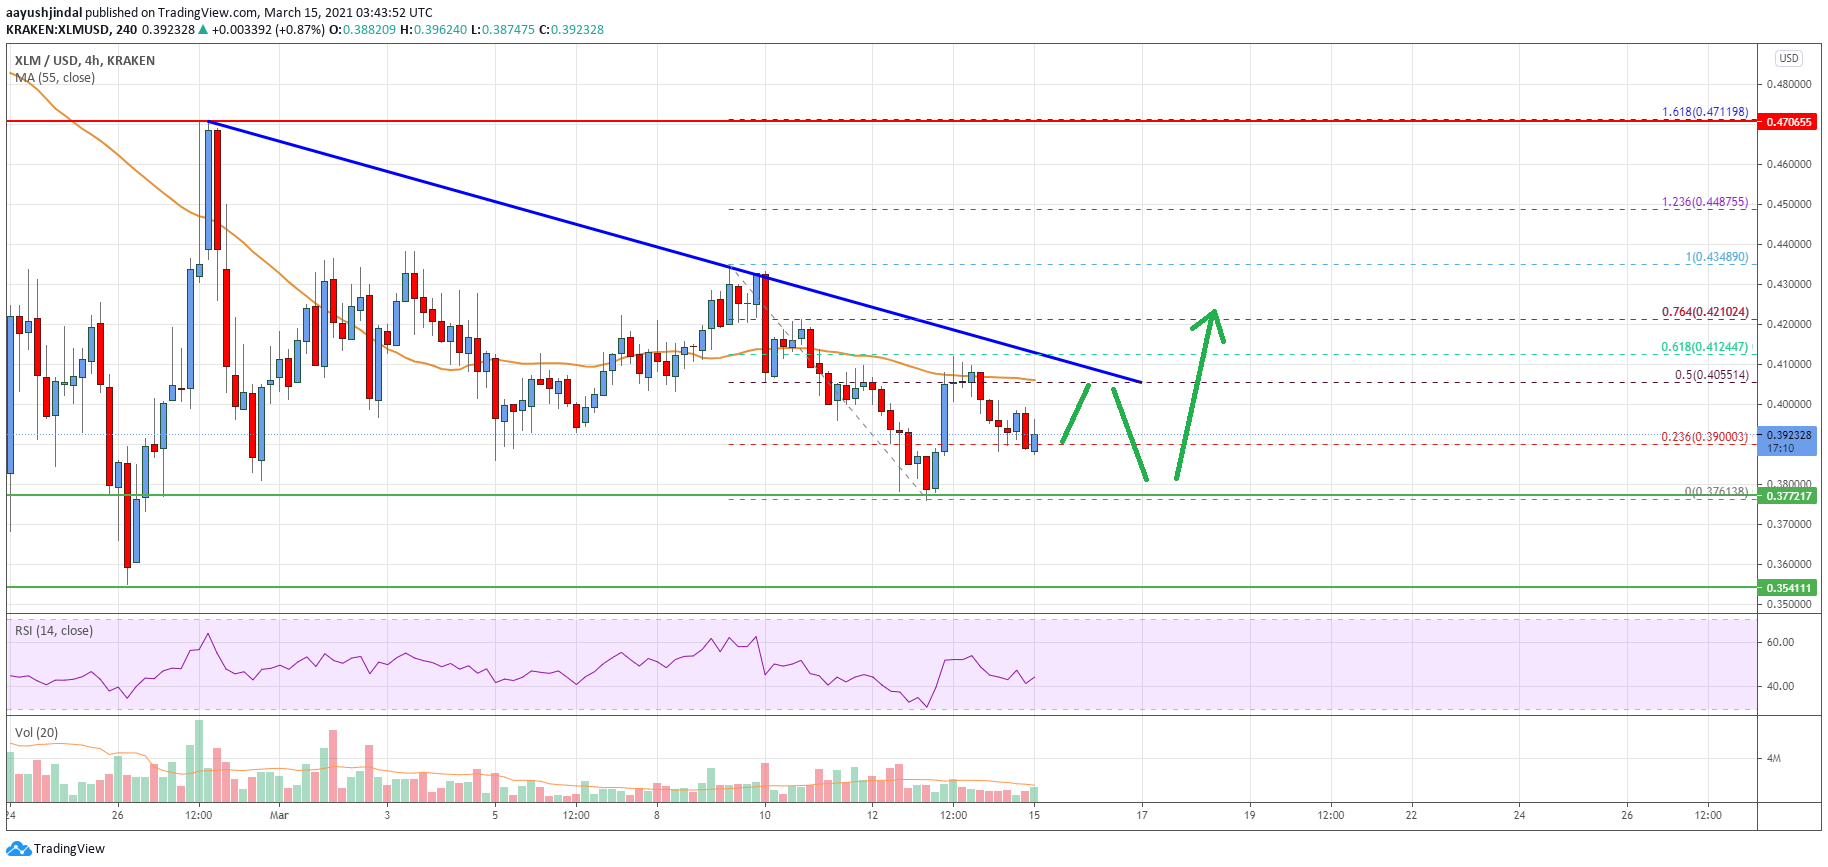
The chart indicates that XLM price is clearly consolidating below $0.4100 and the 55 simple moving average (4-hours). Overall, the price could start a strong increase if it manages to clear $0.4060 and $0.4200.
Technical Indicators
4 hours MACD – The MACD for XLM/USD is struggling to gain momentum in the bullish zone.
4 hours RSI – The RSI for XLM/USD is currently below the 50 level.
Key Support Levels – $0.3800 and $0.3750.
Key Resistance Levels – $0.4060, $0.4200 and $0.4500.


Leave a Reply
You must be logged in to post a comment.