- Bitcoin price started a fresh increase above the $52,000 resistance zone against the US Dollar.
- The price is now trading well above $52,000 and the 55 simple moving average (4-hours).
- There is a major bullish trend line forming with support near $51,800 on the 4-hours chart of the BTC/USD pair (data feed from Coinbase).
- The pair is likely to continue higher above the $55,000 and $56,000 levels in the near term.
Bitcoin price started a fresh rally from $43,000 against the US Dollar. BTC is now back in a bullish zone above $52,000 and it is likely to climb further above $55,000.
Bitcoin Price Analysis
In the past few days, there was a steady upward move in bitcoin price above $50,000 against the US Dollar. BTC even broke the $52,000 resistance zone and settled above the 55 simple moving average (4-hours).
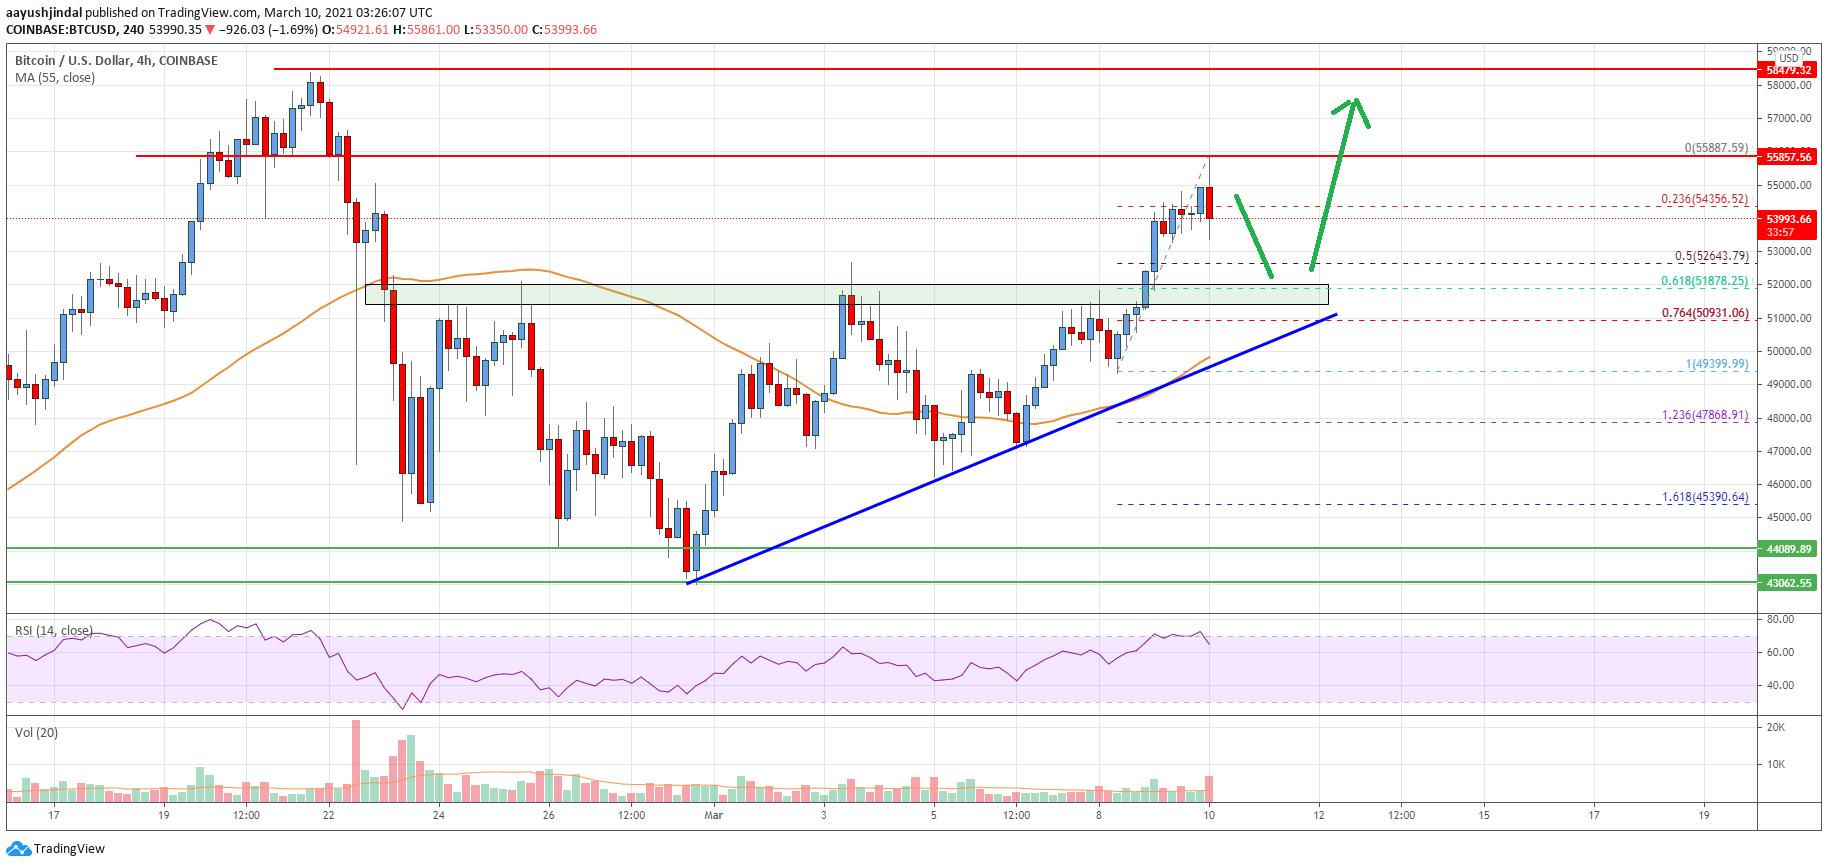
The price surged above the $53,500 level and traded as high as $53,887. It is now consolidating gains and trading below $55,000. There was a break below the 23.6% Fib retracement level of the recent increase from the $49,399 low to $55,887 high.
It is now trading well above $52,000 and the 55 simple moving average (4-hours). The first major support on the downside is near the $52,650 level. It is close to the 50% Fib retracement level of the recent increase from the $49,399 low to $55,887 high.
There is also a major bullish trend line forming with support near $51,800 on the 4-hours chart of the BTC/USD pair. It seems like the previous resistance near $51,800 and $52,000 could act as a strong support.
The next major support could be $50,000 and the 55 simple moving average (4-hours). On the upside, the price is facing resistance near the $55,000 level. The next key resistance is near the $55,800 level, above which the bulls are likely to take control. In the stated case, there are high chances of a new all-time high above the $58,000 level in the near term.
Looking at the chart, bitcoin price is clearly trading well above $52,000 and the 55 simple moving average (4-hours). Overall, the price is likely to continue higher above the $55,000 and $56,000 levels in the near term.
Technical indicators
4 hours MACD – The MACD is slowly gaining momentum in the bullish zone.
4 hours RSI (Relative Strength Index) – The RSI is now above the 50 level.
Key Support Levels – $52,650 and $51,800.
Key Resistance Levels – $55,000, $56,500 and $58,000.