
- Bitcoin price rallied to a new all-time high near $58,440 before correcting lower against the US Dollar.
- The price declined sharply below $52,000 and the 55 simple moving average (4-hours).
- There was a break below a major bullish trend line with support at $51,660 on the 4-hours chart of the BTC/USD pair (data feed from Coinbase).
- The pair is recovering, but it must surpass $52,000 to continue higher in the near term.
Bitcoin price started a downside correction from well above $55,000 against the US Dollar. BTC is recovering losses, but the $52,000 resistance holds the key in the near term.
Bitcoin Price Analysis
In the past few days, there was a steady increase in bitcoin price above the $50,000 resistance against the US Dollar. BTC broke the $52,000 and $55,000 resistance levels to move further into a positive zone.
A new all-time high was formed near $58,440 before there was a downside correction. The price dipped below the $55,000 and $52,500 levels. There was also a break below a major bullish trend line with support at $51,660 on the 4-hours chart of the BTC/USD pair.
The pair dived below the $50,000 support zone and extended its decline towards $45,000. It traded as low as $44,892 and recently started a decent recovery wave.
There was a break above the $48,000 resistance level. The pair climbed above the 23.6% Fib retracement level of the recent drop from the $58,442 high to $44,892 low. It is now trading just above $50,000, but the bulls are facing many key hurdles.
The first major resistance is near the $51,600 level. It is close to the 50% Fib retracement level of the recent drop from the $58,442 high to $44,892 low. The main resistance is now forming near the $52,000 level and the 55 simple moving average (4-hours).
A close above the $52,000 level is needed to start a fresh increase. In the stated case, the price will most likely rally above the $55,000 level. Conversely, there could be another downside correction below the $48,000 support. The main support is forming near the $45,000 level.
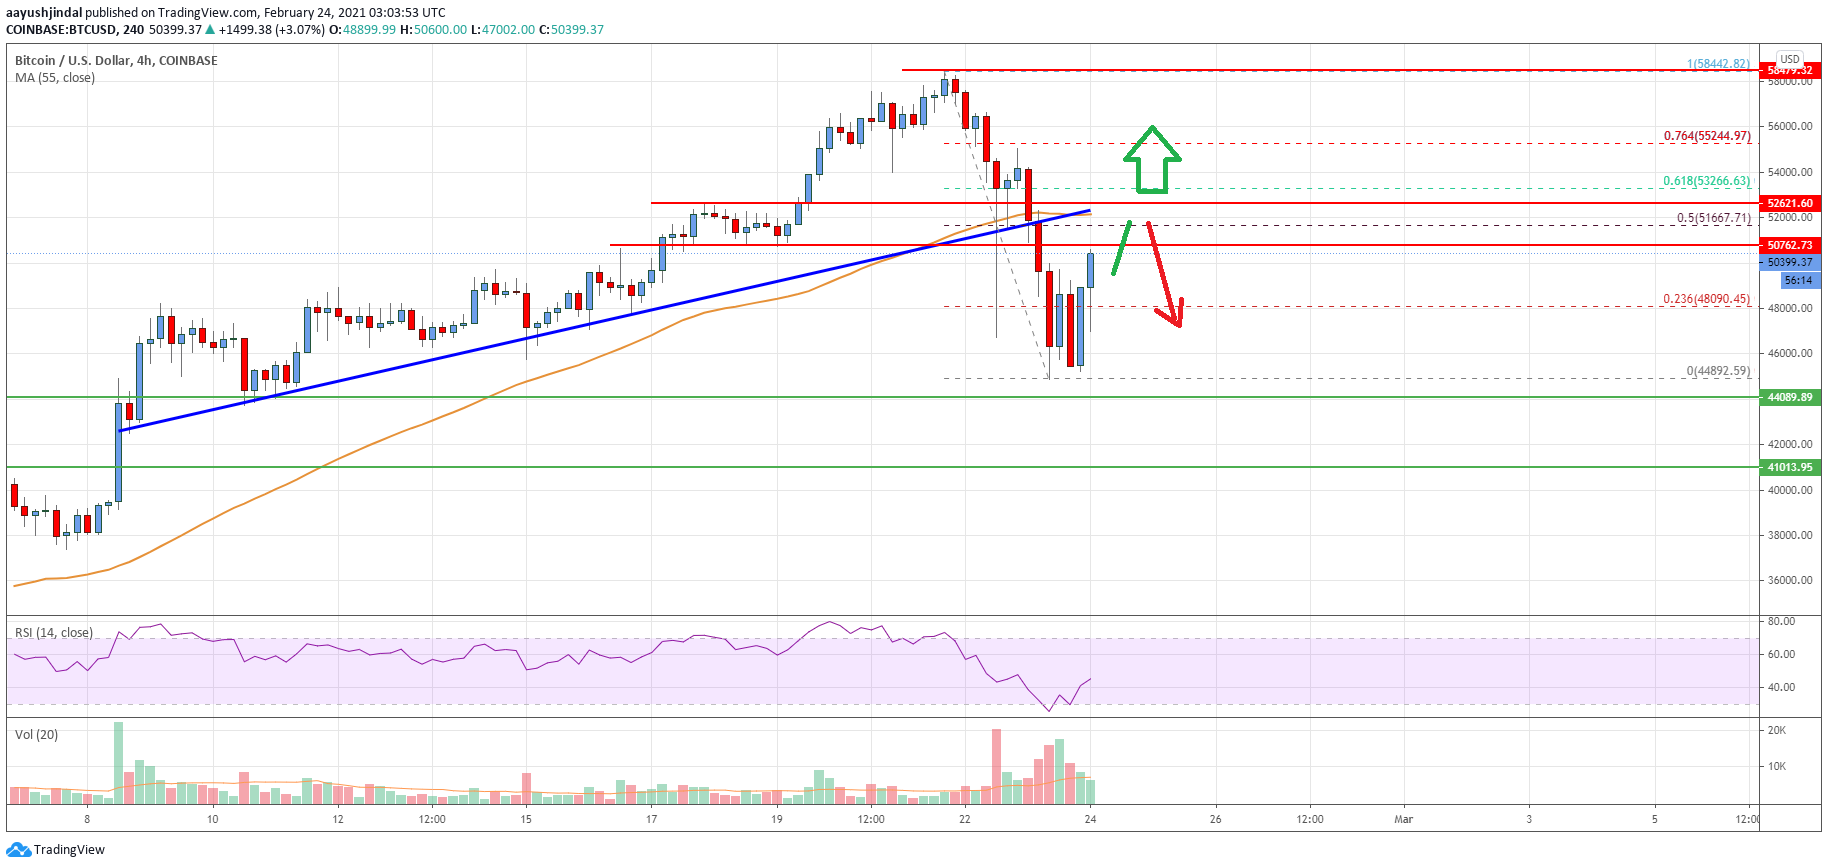
Looking at the chart, bitcoin price is clearly facing hurdles near $52,000 and the 55 simple moving average (4-hours). Overall, the price is recovering, but it must surpass $52,000 to continue higher in the near term.
Technical indicators
4 hours MACD – The MACD is now gaining momentum in the bullish zone.
4 hours RSI (Relative Strength Index) – The RSI is recovering towards the 50 level.
Key Support Levels – $48,000 and $45,000.
Key Resistance Levels – $51,600, $52,000 and $55,000.


Leave a Reply
You must be logged in to post a comment.