- Stellar lumen price started a fresh increase above the $0.5000 resistance zone against the US Dollar.
- XLM price is now trading well above $0.5000 and the 55 simple moving average (4-hours).
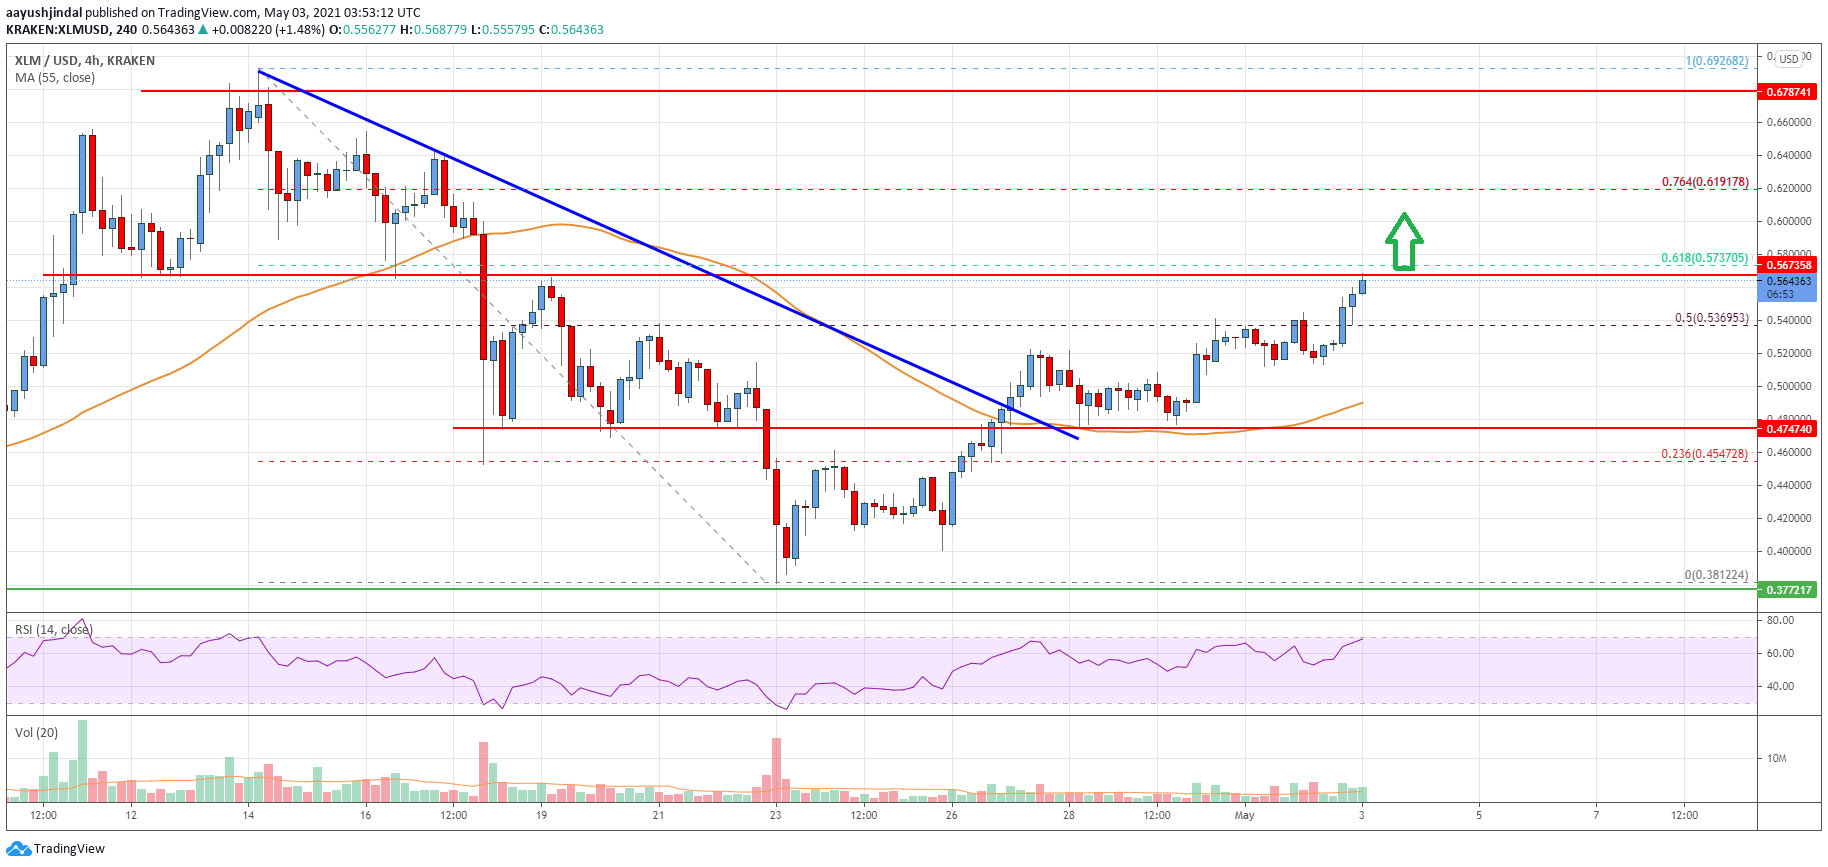
- There was a break above a major bearish trend line with resistance near $0.4950 on the 4-hours chart (data feed via Kraken).
- The pair is likely to accelerate higher above the $0.5750 and $0.6000 resistance levels.
Stellar lumen price is gaining pace above $0.5000 against the US Dollar, similar to bitcoin. XLM price could extend its rally once there is a close above $0.5750.
Stellar Lumen Price Analysis (XLM to USD)
After testing the $0.3800 support zone, stellar lumen price started a fresh increase against the US Dollar. The XLM/USD pair broke the $0.4000 and $0.4500 resistance levels to move into a positive zone.
There was also a break above a major bearish trend line with resistance near $0.4950 on the 4-hours chart. The pair is now trading well above $0.5000 and the 55 simple moving average (4-hours). There was a break above the 50% Fibonacci retracement level of the downward move from the $0.6926 swing high to $0.3812 low.
It is now consolidating gains above the $0.5500 support zone. An immediate resistance is near the $0.5750 level. The 61.8% Fibonacci retracement level of the downward move from the $0.6926 swing high to $0.3812 low is also near the $0.5750 level.
The next major resistance is near the $0.6200 level. A successful break above the $0.6200 resistance level could set the pace for a strong upward move. In the stated case, the price could easily rise towards the $0.6500 level or even $0.6800.
On the downside, an initial support is near the $0.5500 level. The first key support is near the $0.5200 level. The main support is now forming near $0.5000 and the 55 simple moving average (4-hours).

The chart indicates that XLM price is clearly trading well above $0.5000 and the 55 simple moving average (4-hours). Overall, the price is likely to accelerate higher above the $0.5750 and $0.6000 resistance levels in the near term.
Technical Indicators
4 hours MACD – The MACD for XLM/USD is now gaining momentum in the bullish zone.
4 hours RSI – The RSI for XLM/USD is currently well above the 60 level.
Key Support Levels – $0.5200 and $0.5000.
Key Resistance Levels – $0.5750, $0.6200 and $0.6500.


Leave a Reply
You must be logged in to post a comment.