
- Ripple price started a steady increase above the $1.20 resistance zone against the US dollar.
- The price is now trading well above $1.50 and the 55 simple moving average (4-hours).
- There was a break above a major bearish trend line with resistance near $1.20 on the 4-hours chart of the XRP/USD pair (data source from Bittrex).
- The pair could start a major increase if there is a clear break above $1.65 and $1.70.
Ripple price is gaining pace above the $1.50 level against the US Dollar. XRP price is likely to accelerate higher if there is a close above $1.70.
Ripple Price Analysis
After testing the $0.8500 zone, ripple price started a fresh increase against the US Dollar. The XRP/USD pair broke the $1.00 and $1.20 resistance levels to move back into a positive zone.
There was a break above a major bearish trend line with resistance near $1.20 on the 4-hours chart of the XRP/USD pair. The price broke the $1.25 resistance zone and the 55 simple moving average (4-hours).
The bulls gained control and pushed the price above the 61.8% Fib retracement level of the key decline from the $1.96 swing high to $0.8733 low. The price is now trading well above $1.50 and the 55 simple moving average (4-hours).
It seems like there is a rising channel forming with support near $1.50 on the same chart. On the upside, there is a major resistance forming near the $1.70 zone.
The 76.4% Fib retracement level of the key decline from the $1.96 swing high to $0.8733 low is also near $1.70. A clear break above the $1.70 resistance zone could set the pace for a move towards the $2.00 resistance zone.
Conversely, the price might correct lower. An initial support is near the channel trend line at $1.50. A downside break below the channel support might call for a test of the $1.30 support and the 55 simple moving average (4-hours).
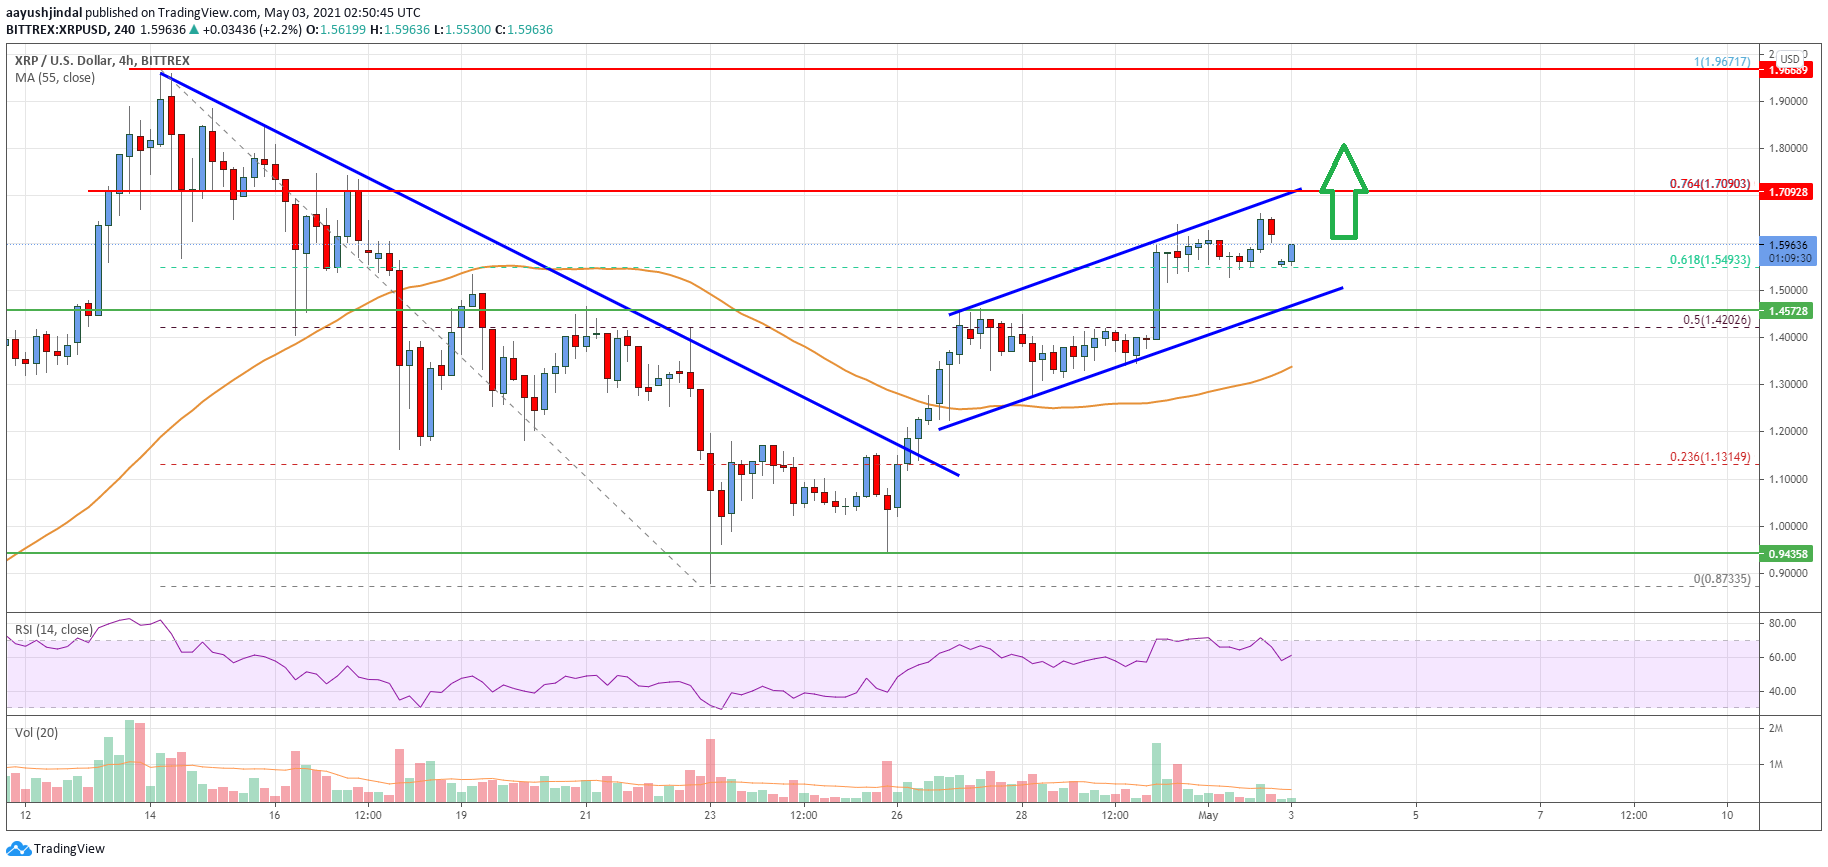
Looking at the chart, ripple price is clearly trading nicely above $1.50 and the 55 simple moving average (4-hours). Overall, the price could start a major increase if there is a clear break above $1.65 and $1.70.
Technical indicators
4 hours MACD – The MACD for XRP/USD is slowly gaining momentum in the bullish zone.
4 hours RSI (Relative Strength Index) – The RSI for XRP/USD is now above the 50 level.
Key Support Levels – $1.50, $1.40 and $1.20.
Key Resistance Levels – $1.65 and $1.70.


Leave a Reply
You must be logged in to post a comment.