- Stellar lumen price is declining below the key $0.0550 support area against the US Dollar.
- XLM price is currently struggling to stay above the $0.0500 support area.
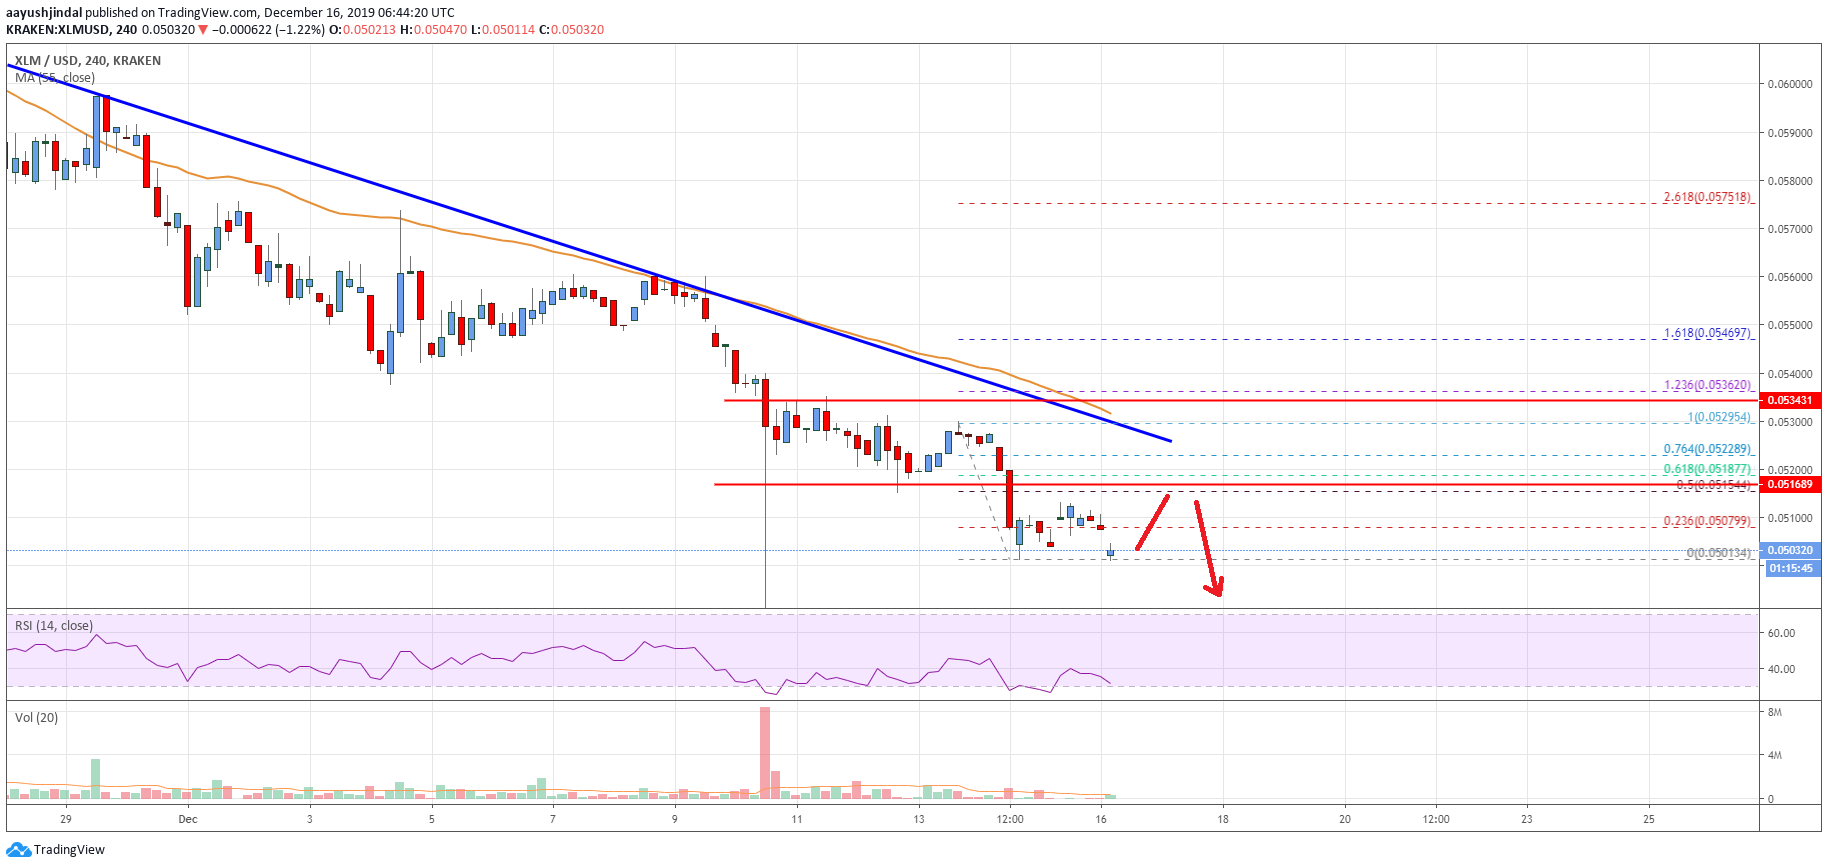
- There is a crucial bearish trend line forming with resistance near $0.0528 on the 4-hours chart (data feed via Kraken).
- The pair could tumble if the bears gain strength below the key $0.0500 support area.
Stellar lumen price is gaining bearish momentum against the US Dollar and bitcoin. XLM price must recover above $0.0550 to avoid additional losses.
Stellar Lumen Price Analysis (XLM to USD)
In the past few weeks, stellar lumen price mostly followed a bearish path below the $0.0600 support against the US Dollar. Moreover, the XLM/USD pair settled below the $0.0550 support area and the 55 simple moving average (4-hours).
The price is now trading well below $0.0540 and $0.0520. The recent monthly low is $0.0501 and the price is currently consolidating losses.
An initial resistance is near the $0.0515 level. Besides, the 50% Fibonacci retracement level of the recent decline from the $0.0529 high to $0.0501 low is near the $0.0515 level.
The first major resistance is near the $0.0525 area. Additionally, there is a crucial bearish trend line forming with resistance near $0.0528 on the 4-hours chart. The trend line is close to the 76.4% Fibonacci retracement level of the recent decline from the $0.0529 high to $0.0501 low.
More importantly, the 55 simple moving average (4-hours) is positioned near the $0.0535 area. Therefore, the price must surpass the $0.0520 and $0.0535 resistance levels to start a decent recovery.
The next major resistance is near the $0.0550 level, above which stellar price is likely to recover towards the $0.0600 and $0.0620 resistance levels.
Conversely, the price is likely to continue lower below the main $0.0500 support area. In the mentioned case, the bears are likely to gain strength below $0.0500.
The next support is seen near the $0.0480 level, below which there is a risk of a downside thrust towards the $0.0450 support area in the coming sessions.
The chart indicates that XLM price is clearly facing an increase in selling pressure below the $0.0520 and $0.0535 levels. As long as there is no close above $0.0535 and $0.0550, the price remains at a risk of more losses below the $0.0500 level.
Technical Indicators
4 hours MACD – The MACD for XLM/USD is currently gaining momentum in the bearish zone.
4 hours RSI – The RSI for XLM/USD is declining and it is approaching the 30 level.
Key Support Levels – $0.0500 and $0.0480.
Key Resistance Levels – $0.0515, $0.0520 and $0.0535.


Leave a Reply
You must be logged in to post a comment.