
- Stellar lumen price is down more than 20% and it recently traded below $0.0600 against the US Dollar.
- XLM price is currently sliding and it seems like it could soon test the $0.0500 support area.
- There is a crucial bearish trend line forming with resistance near $0.0580 on the 4-hours chart (data feed via Kraken).
- The pair is unlikely to correct higher unless the bears fail to push the price below $0.0512.
Stellar lumen price is sliding heavily against the US Dollar, similar to bitcoin. XLM price is likely to test the key $0.0500 support, where buyers could emerge.
Stellar Lumen Price Analysis (XLM to USD)
This past week, stellar lumen price failed to stay above the key $0.0700 support area against the US Dollar. As a result, the XLM/USD pair started a steady decline and broke many key supports near $0.0685 and $0.0640.
Moreover, there was a break below the $0.0600 support area and the price settled well below the 55 simple moving average (4-hours). The last low was near $0.0533 before the price corrected higher.
However, the upward move was capped by the $0.0620 resistance area. More importantly, there is a crucial bearish trend line forming with resistance near $0.0580 on the 4-hours chart.
Stellar price is currently declining and it is now trading below the 76.4% Fibonacci retracement level of the upward move from the $0.0533 low to $0.0620 high. An immediate support is near the $0.0533 low.
If there is a downside break, the price could test the $0.0512 support. It represents the 1.236 Fib extension level of the upward move from the $0.0533 low to $0.0620 high. Any further losses may perhaps push the price towards the $0.0500 support area.
On the upside, an initial resistance is near the $0.0565 level. The first key resistance is near the $0.0580 level and the bearish trend line. If there is a break above the trend line, the price could test the $0.0620 resistance area.
The next major resistance is near the $0.0640 level and the 55 simple moving average (4-hours), above which the price is likely to move back into a positive zone.
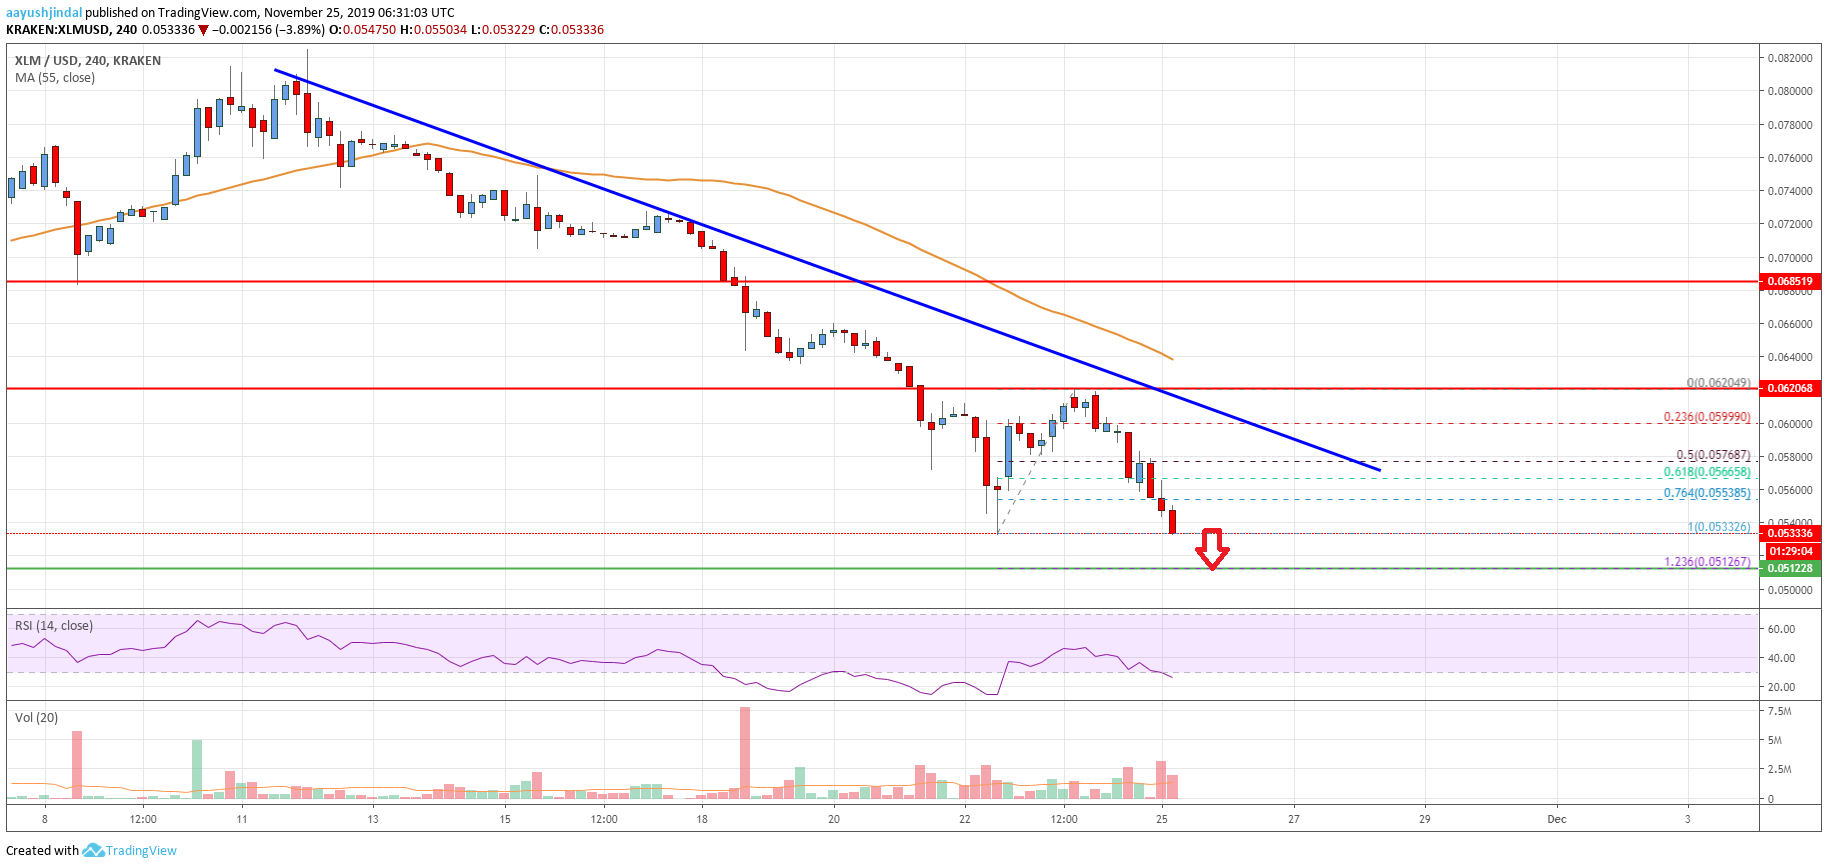
The chart indicates that XLM price is sliding and trading in a bearish zone below $0.0580 and $0.0620. The bears seem to be aiming the $0.0500 support before the price could start a decent recovery towards $0.0580 or $0.0600 in the near term.
Technical Indicators
4 hours MACD – The MACD for XLM/USD is currently gaining momentum in the bearish zone.
4 hours RSI – The RSI for XLM/USD is currently declining and it is well below the 40 level.
Key Support Levels – $0.0512 and $0.0500.
Key Resistance Levels – $0.0580, $0.0600 and $0.0620.


Leave a Reply
You must be logged in to post a comment.