- Stellar lumen price is currently correcting lower from the $0.0500 resistance against the US Dollar.
- XLM price remains well supported on the downside near the $0.0466 and $0.0460 levels.
- There is a key contracting triangle forming with resistance near $0.0490 on the 4-hours chart (data feed via Kraken).
- The pair could start a nice upward move if it breaks the $0.0490 and $0.0500 resistance levels.
Stellar lumen price is showing positive signs above $0.0450 against the US Dollar, similar to bitcoin above $7,700. XLM is likely to find buyers if it dips towards $0.0450.
Stellar Lumen Price Analysis (XLM to USD)
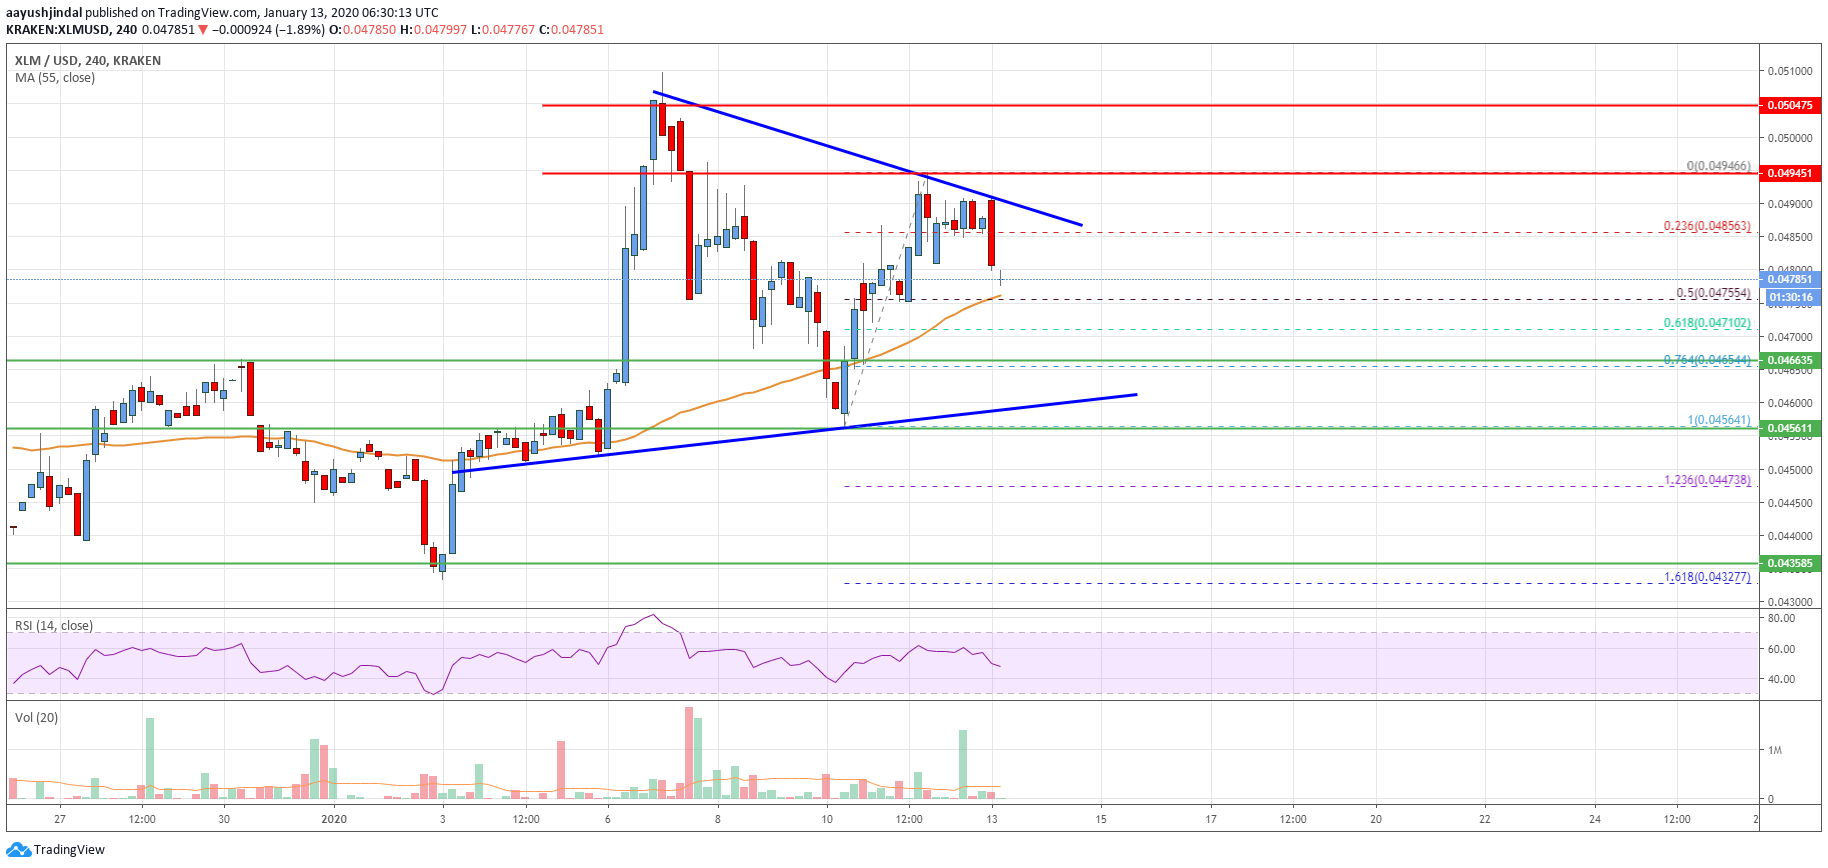
In the past few days, stellar lumen price gained pace above the $0.0450 resistance against the US Dollar. The XLM/USD pair even settled above the $0.0460 level and the 55 simple moving average (4-hours).
Finally, the price tagged the $0.0500 and $0.0505 resistance levels before correcting lower. It dipped sharply, but the $0.0450 zone acted as a support. The recent swing low was near $0.0456 and the high was $0.0494.
The price is currently correcting lower below $0.0490. It broke the 23.6% Fibonacci retracement level of the recent wave from the $0.0456 low to $0.0494 high. On the downside, an initial support is near the $0.0475 level.
Besides, the 55 simple moving average (4-hours) is positioned along with the 50% Fibonacci retracement level of the recent wave from the $0.0456 low to $0.0494 high near the $0.0475 level.
On the upside, there are hurdles forming for stellar price near $0.0490 and $0.0500. More importantly, there is a key contracting triangle forming with resistance near $0.0490 on the 4-hours chart.
Therefore, a clear break above the $0.0490 and $0.0500 resistance levels might set the pace for more gains in the near term. The next key resistances are seen near the $0.0520 and $0.0528 levels.
Conversely, the price might dip below the $0.0475 support and the 55 simple moving average (4-hours). The next major support is near the $0.0460 and $0.0455 levels, below which the bears are likely to take control.
The chart indicates that XLM price is clearly trading in a positive zone above the $0.0475 and $0.0460 support levels. As long as there is no close below $0.0460, the price is likely to surpass the $0.0490 and $0.0500 resistance levels in the near term.
Technical Indicators
4 hours MACD – The MACD for XLM/USD is currently losing momentum in the bullish zone.
4 hours RSI – The RSI for XLM/USD is currently just below the 50 level.
Key Support Levels – $0.0475 and $0.0460.
Key Resistance Levels – $0.0490, $0.0500 and $0.0505.