- Stellar lumen price is gaining bullish momentum above the $0.0550 resistance against the US Dollar.
- XLM price is likely sighting an important bullish above the $0.0600 resistance area.
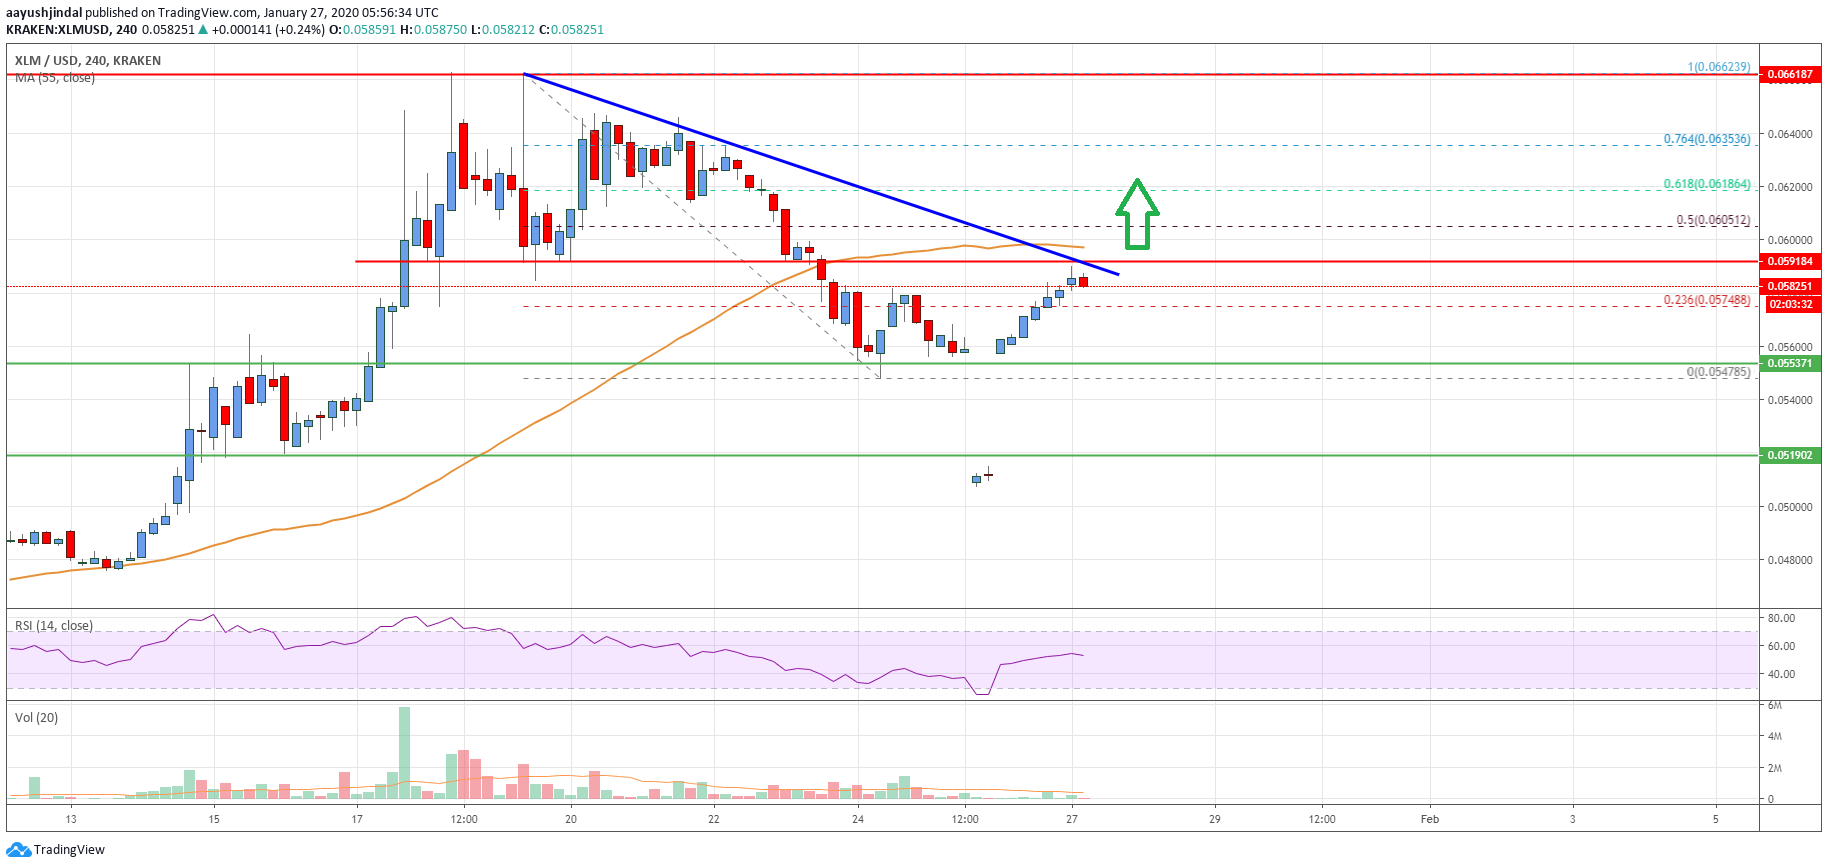
- There is a key bearish trend line forming with resistance near $0.0592 on the 4-hours chart (data feed via Kraken).
- The pair start a strong rise once it settles above the $0.0595 and $0.0600 resistance levels.
Stellar lumen price is showing many bullish signs against the US Dollar, similar to bitcoin. XLM is likely rally above $0.0600 as long as it is above the $0.0520 level.
Stellar Lumen Price Analysis (XLM to USD)
After a decent rise above the $0.0620 level, stellar lumen price found resistance near the $0.0660 level against the US Dollar. As a result there was a downside correction in the XLM/USD pair below the $0.0620 level.
The price even broke the $0.0600 level and the 55 simple moving average (4-hours). Finally, there was a spike below the $0.0550 level. A low is formed near $0.0547 and the price is currently climbing higher.
It broke the 23.6% Fibonacci retracement level of the downward move from the $0.0662 high to $0.0547 low. However, the price is now facing a strong resistance near the $0.0600 area.
Besides, there is a key bearish trend line forming with resistance near $0.0592 on the 4-hours chart. The 55 simple moving average (4-hours) is also around the trend line resistance.
More importantly, the 50% Fibonacci retracement level of the downward move from the $0.0662 high to $0.0547 low is near the $0.0605 level. Therefore, the price must break the $0.0600 and $0.0605 resistance levels to continue higher.
The next major resistance is near the $0.0620 level, above which stellar price is likely to accelerate towards the $0.0650 level in the near term.
On the downside, an initial support is near the $0.0575 level. The main support is near the $0.0550 level, below which the bears are likely to take control in the coming sessions.

The chart indicates that XLM price is approaching a crucial resistance area near $0.0600. A successful close above the $0.0600 level could start a strong rise. If not, the price might decline back towards the $0.0550 support.
Technical Indicators
4 hours MACD – The MACD for XLM/USD is currently gaining momentum in the bullish zone.
4 hours RSI – The RSI for XLM/USD is currently well above the 50 level.
Key Support Levels – $0.0575 and $0.0550.
Key Resistance Levels – $0.0600, $0.0620 and $0.0650.


Leave a Reply
You must be logged in to post a comment.