- Stellar lumen price declined sharply after it failed to climb above the $0.1200 resistance against the US Dollar.
- XLM price tested the $0.1100 support area and it is currently consolidating losses.
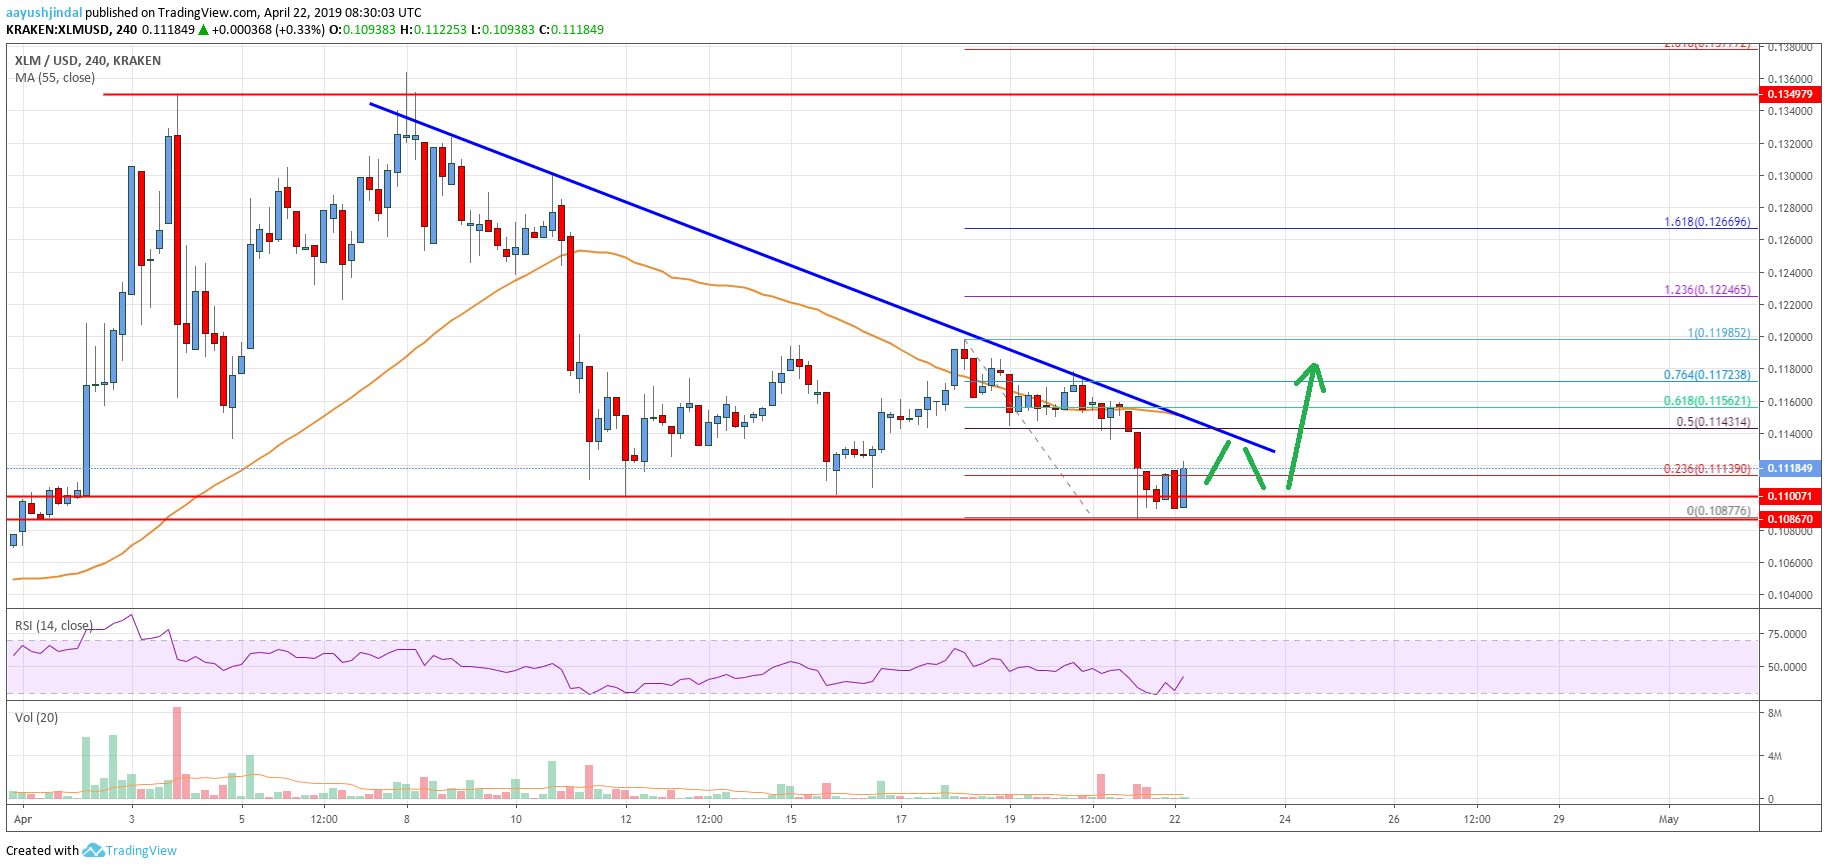
- There is a key bearish trend line formed with resistance at $0.1142 on the 4-hours chart (data feed via Kraken).
- The pair is likely to break the trend line and $0.1150 resistance to start a fresh upward move.
Stellar lumen price trimmed most its gains and declined against the US Dollar, bitcoin and Ethereum. XLM price could bounce back if it continues to stay above the $0.1085 support.
Stellar Lumen Price Analysis (XLM to USD)
This past week, stellar lumen price climbed above the $0.1120 and $0.1150 resistance levels against the US Dollar. The XLM/USD pair even broke the $0.1180 resistance area before sellers protected the $0.1200 zone. A swing high was formed at $0.1198 before the price started a sharp decline. The price broke the $0.1150 and $0.1120 support levels. There was also a close below the $0.1140 level and the 55 simple moving average (4-hours). Besides, the price spiked below the $0.1100 support area and traded to a new weekly low at $0.1087.
Later, the price recovered above $0.1100 and it is currently consolidating losses. It tested the 23.6% Fibonacci retracement level of the last decline from the $0.1198 high to $0.1087 low. However, there are many hurdles on the upside near the $0.1140 and $0.1150 levels. There is also a key bearish trend line formed with resistance at $0.1142 on the 4-hours chart. The 50% Fibonacci retracement level of the last decline from the $0.1198 high to $0.1087 low is also near the $0.1153 level.
More importantly, the 55 simple moving average (4-hours) is positioned near the $0.1150 level. Therefore, a successful close above the $0.1140 level and the 55 simple moving average (4-hours) is must for a strong upward move in the near term. The next main resistance is at $0.1200, where sellers might attempt to prevent an upside break. On the downside, the main supports are near $0.1100 and $0.1085.
The chart indicates that XLM price is clearly trading near key supports at $0.1085. If there is a downside break below $0.1085, the price could accelerate losses towards the $0.1020 level. On the upside, a clear break above the $0.1142 level is likely to encourage buyers to take control.
Technical Indicators
4 hours MACD – The MACD for XLM/USD is slowly reducing its bearish slope, with positive signs.
4 hours RSI – The RSI for XLM/USD is currently recovering from the 35 level and it could test the 50 level.
Key Support Levels – $0.1100 and $0.1085.
Key Resistance Levels – $0.1142, $0.1150 and $0.1200.