- Solana price started a fresh increase from the $120 zone against the US Dollar.
- The price is now trading above $140 and the 55 simple moving average (4 hours).
- There was a break above a key bearish trend line with resistance at $150 on the 4-hour chart of the SOL/USD pair (data feed from Coinbase).
- The pair must clear $160 and $165 to continue higher in the near term.
Solana price is trading in a positive zone above $150 against the US Dollar, like Bitcoin. SOL could start a strong increase if it clears the $165 resistance.
Solana (SOL) Price Analysis
SOL price started a decent upward move from the $120 support zone. The price formed a base and was able to climb above the $132 and $140 levels.
There was a clear move above the 23.6% Fib retracement level of the downward move from the $204 swing high to the $121 low. The bulls were even able to push the price above the $150 resistance zone. Besides, there was a break above a key bearish trend line with resistance at $150 on the 4-hour chart of the SOL/USD pair.
SOL is now trading above $152 and the 55 simple moving average (4 hours). On the upside, immediate resistance is near the $160 level or the 50% Fib retracement level of the downward move from the $204 swing high to the $121 low.
The next major resistance is near the $165 zone. Any more gains might send SOL price towards the $185 resistance zone, above which the price could accelerate higher. The next major resistance sits near the $200 level.
On the downside, initial support is near the $148 level. The next major support is near the $140 level. A downside break below the $140 support level might push the price toward the $132 support. Any more losses might open the doors for more losses toward $120.
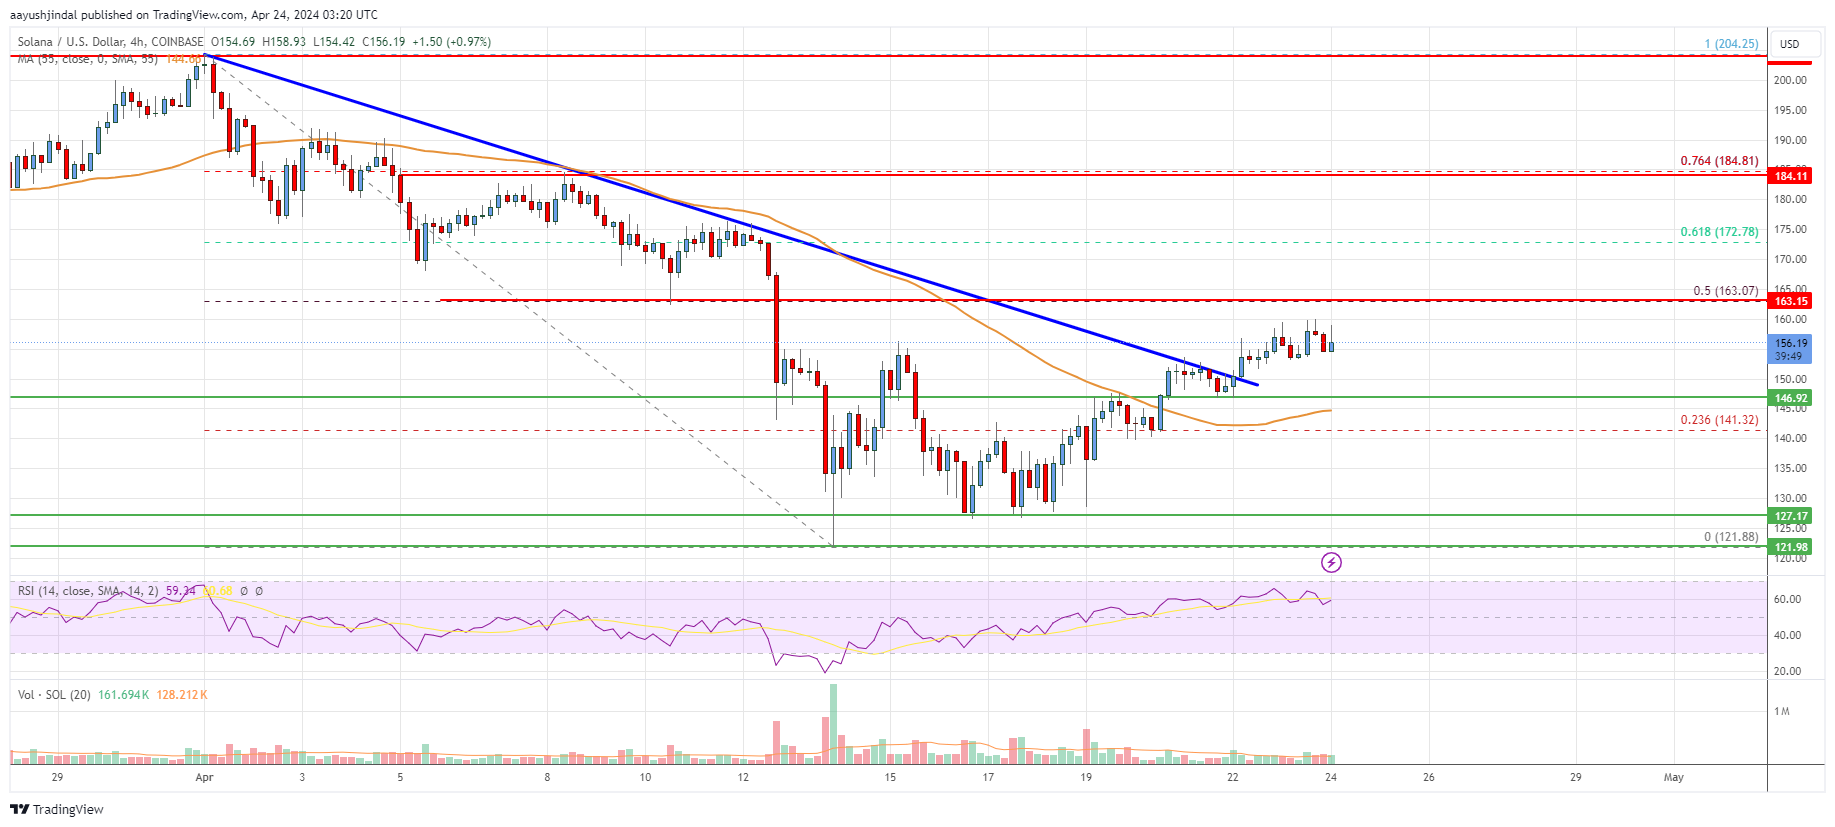
Looking at the chart, Solana price is trading above $150 and the 55 simple moving average (4 hours). Overall, the price must clear $160 and $165 to continue higher in the near term.
Technical Indicators
4 hours MACD – The MACD is now gaining momentum in the bullish zone.
4 hours RSI (Relative Strength Index) – The RSI is now above the 50 level.
Key Support Levels – $148 and $140.
Key Resistance Levels – $160, $165, and $185.
