- Stellar lumen price is currently gaining bullish momentum above the $0.0500 resistance area against the US Dollar.
- XLM price is likely to accelerate gains above the $0.0520 and $0.0550 resistance levels.
- There was a break above a major bearish trend line with resistance near $0.0490 on the 4-hours chart (data feed via Kraken).
- The pair is showing a lot of bullish signs above the $0.0500 support and the 55 simple moving average (4-hours).
Stellar lumen price is trading in a strong uptrend against the US Dollar and bitcoin. XLM price could continue to rise steadily towards the $0.0550 and $0.0600 resistance levels.
Stellar Lumen Price Analysis (XLM to USD)
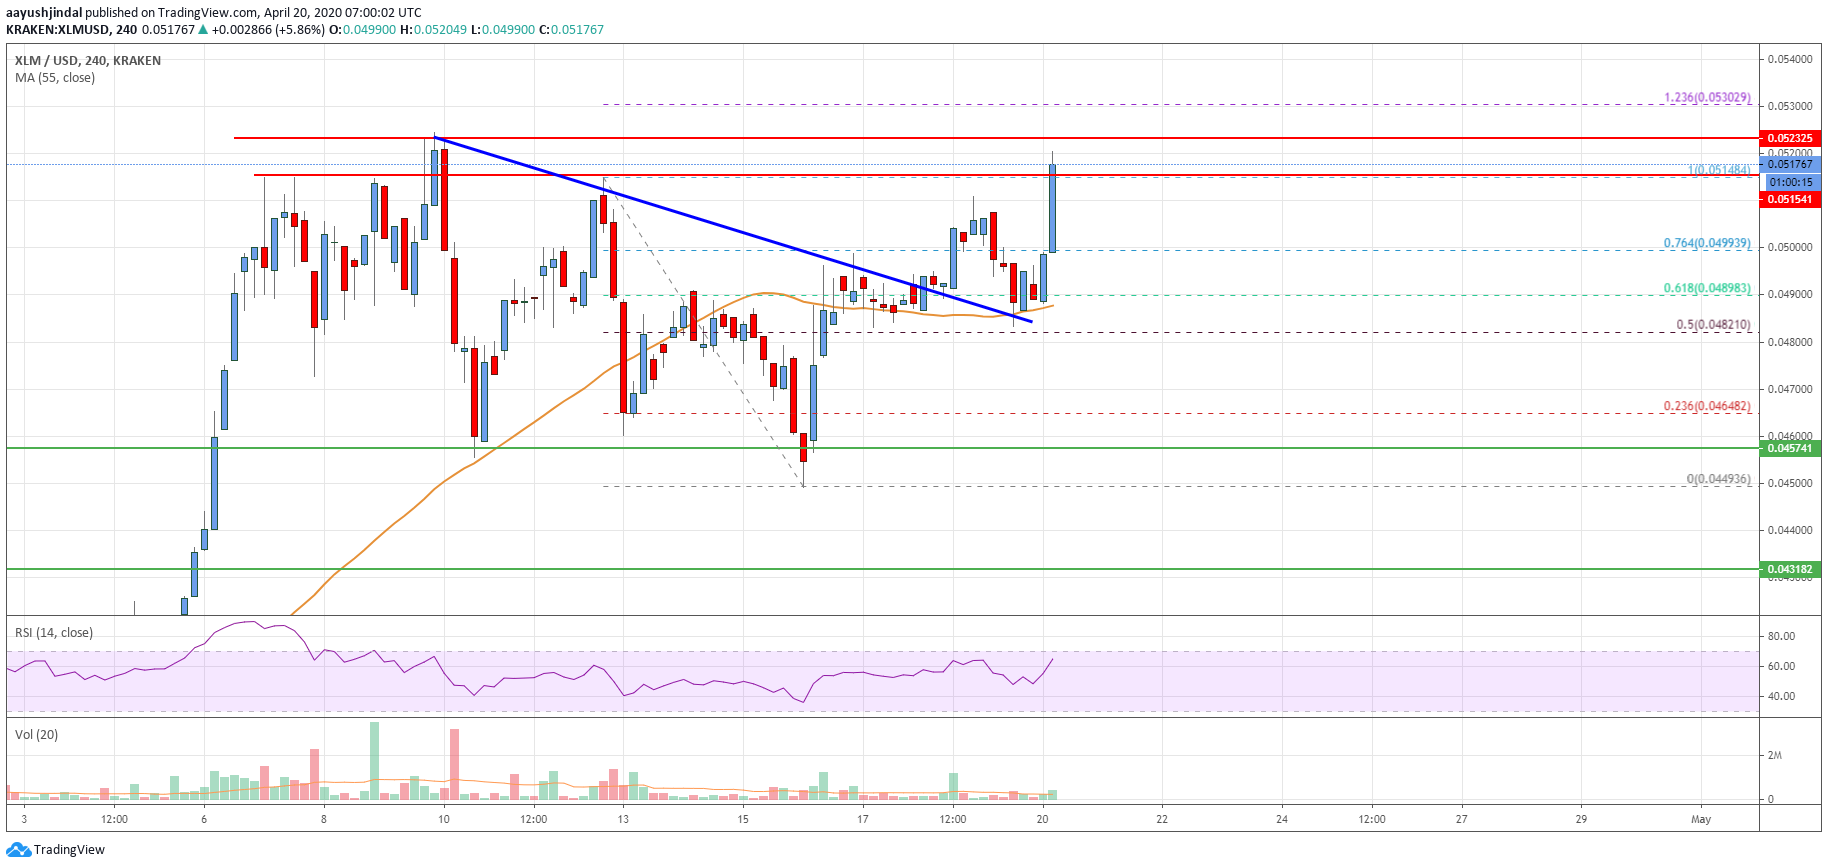
This past week, stellar lumen price retested the main $0.0450 support zone against the US Dollar. The XLM/USD pair traded as low as $0.0449 and later started a fresh increase.
There was clear break above the $0.0480 resistance to start a convincing upward move. The bulls pushed the price above the $0.0500 resistance area and the 55 simple moving average (4-hours).
Besides, there was a break above a major bearish trend line with resistance near $0.0490 on the 4-hours chart. The price is now trading well above the 76.4% Fibonacci retracement level of the last key decline from the $0.0514 high to $0.0449 low.
It is testing the $0.0514 and approaching the main $0.0520 resistance area. If there is an upside break above the $0.0520 resistance, the price might continue to rise towards the $0.0550 resistance area.
An intermediate resistance could be the $0.0530 level or the 1.236 Fib extension level of the last key decline from the $0.0514 high to $0.0449 low. Any further gains could open the doors for a sharp rise towards the $0.0600 resistance area in the near term.
On the downside, an initial support is near the $0.0500 level. The first key support is near the $0.0488 level and the 55 simple moving average (4-hours). Any further losses may perhaps lead the price towards the $0.0450 support area.
The chart indicates that XLM price is clearly trading in a strong uptrend above the $0.0500 level. If the bulls remain in action and pushes the price above the $0.0520 resistance, there could be a solid rally towards the $0.0550 level or even $0.0600 in the coming sessions.
Technical Indicators
4 hours MACD – The MACD for XLM/USD is currently gaining pace in the bullish zone.
4 hours RSI – The RSI for XLM/USD is now well above the 55 level.
Key Support Levels – $0.0488 and $0.0450.
Key Resistance Levels – $0.0520, $0.0550 and $0.0600.