- Stellar lumen price is still struggling to gain pace above $0.0850 and $0.0860 against the US Dollar.
- XLM price is holding the key $0.0780 support, but it is below the 55 simple moving average (4-hours).
- There is a key contracting triangle forming with resistance near $0.0832 on the 4-hours chart (data feed via Kraken).
- The pair could either decline sharply below the $0.0780 support or start a sharp rise towards $0.0900.
Stellar lumen price is trading near a major support at $0.0780 against the US Dollar, while bitcoin is above $16K. XLM price must stay above $0.0780 to start a fresh increase.
Stellar Lumen Price Analysis (XLM to USD)
In the past few days, stellar lumen price made a couple of attempts to settle above $0.0850 and $0.0860 against the US Dollar. However, the XLM/USD pair failed to gain momentum and declined recently from the $0.0843 swing high.
There was a break below the $0.0820 support level and the 55 simple moving average (4-hours). The price even broke the $0.0800 support level, but the bulls were able to defend losses below the $0.0780 support.
A low is formed near $0.0790 and the price is currently consolidating losses. An initial resistance is near the $0.0810 level and the 55 simple moving average (4-hours). The next major resistance is near the $0.0817 level since it is close to the 50% Fibonacci retracement level of the recent decline from the $0.0843 high to $0.0790 low.
More importantly, there is a key contracting triangle forming with resistance near $0.0832 on the 4-hours chart. The triangle resistance is near the 76.4% Fibonacci retracement level of the recent decline from the $0.0843 high to $0.0790 low.
The price is clearly facing a lot of hurdles, starting with $0.0810 and up to $0.0850. A clear close above the $0.0850 level is must for a sustained upward move in the coming sessions.
Conversely, there is a risk of a fresh decline below the triangle support and $0.0800. An initial support is near the $0.0780 level, below which the price could dive towards the $0.0720 support.
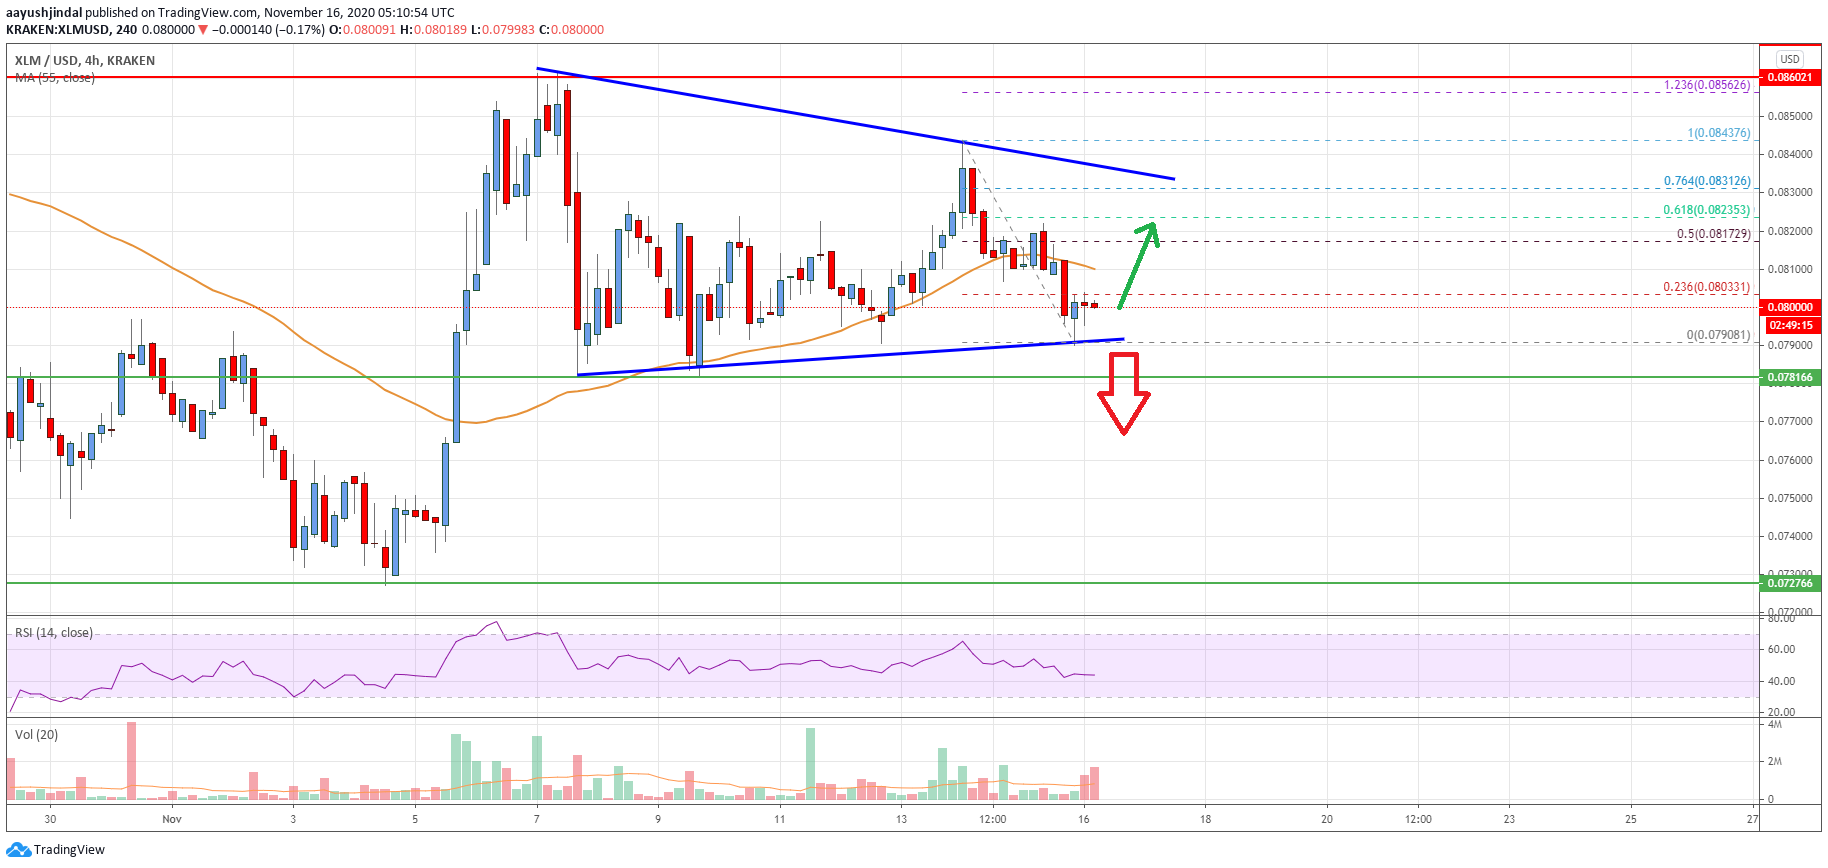
The chart indicates that XLM price is clearly consolidating above $0.0800 and the 55 simple moving average (4-hours). Overall, the price could either decline sharply below the $0.0780 support or start a sharp rise towards $0.0900.
Technical Indicators
4 hours MACD – The MACD for XLM/USD is struggling to gain momentum in the bearish zone.
4 hours RSI – The RSI for XLM/USD is recovering towards the 50 level.
Key Support Levels – $0.0800 and $0.0780.
Key Resistance Levels – $0.0830, $0.0850 and $0.0860.