- Stellar lumen price remained in a bearish zone and it tested the $0.0720 support zone against the US Dollar.
- XLM price is currently declining below $0.0780 and the 55 simple moving average (4-hours).
- There is a major declining channel forming with resistance near $0.0780 on the 4-hours chart (data feed via Kraken).
- The pair could either nosedive below $0.0740 or it might correct above the $0.0800 resistance.
Stellar lumen price is struggling to recover above $0.0800 against the US Dollar, similar to bitcoin near $11,000. XLM price could decline sharply unless it surges past $0.0800.
Stellar Lumen Price Analysis (XLM to USD)
After a steady decline, stellar lumen price found support near the $0.0725 zone against the US Dollar. The XLM/USD pair traded as low as $0.0722 and started an upside correction above $0.0750.
The pair was able to climb above the $0.0800 resistance and the 55 simple moving average (4-hours). However, the upward move was capped by the $0.0850 resistance. As a result, there was a fresh decline below the $0.0800 level.
The recent low was formed near $0.0753 and the price is currently consolidating losses. It is testing the 23.6% Fibonacci retracement level of the recent decline from the $0.0823 high to $0.0753 low.
It seems like there is a major declining channel forming with resistance near $0.0780 on the 4-hours chart. Above the channel resistance, the next hurdle is near the $0.0788 level. It is close to the 50% Fibonacci retracement level of the recent decline from the $0.0823 high to $0.0753 low.
The main resistance is near the $0.0800 level and the 55 simple moving average (4-hours). A successful close above the channel resistance and the $0.0800 barrier may perhaps open the doors for a larger increase.
Conversely, the price might fail to climb higher and it could extend its decline below $0.0750. The first major support below the $0.0750 level is near the $0.0720 level. If there is a clear break below $0.0720, the price could even slide below $0.0700.
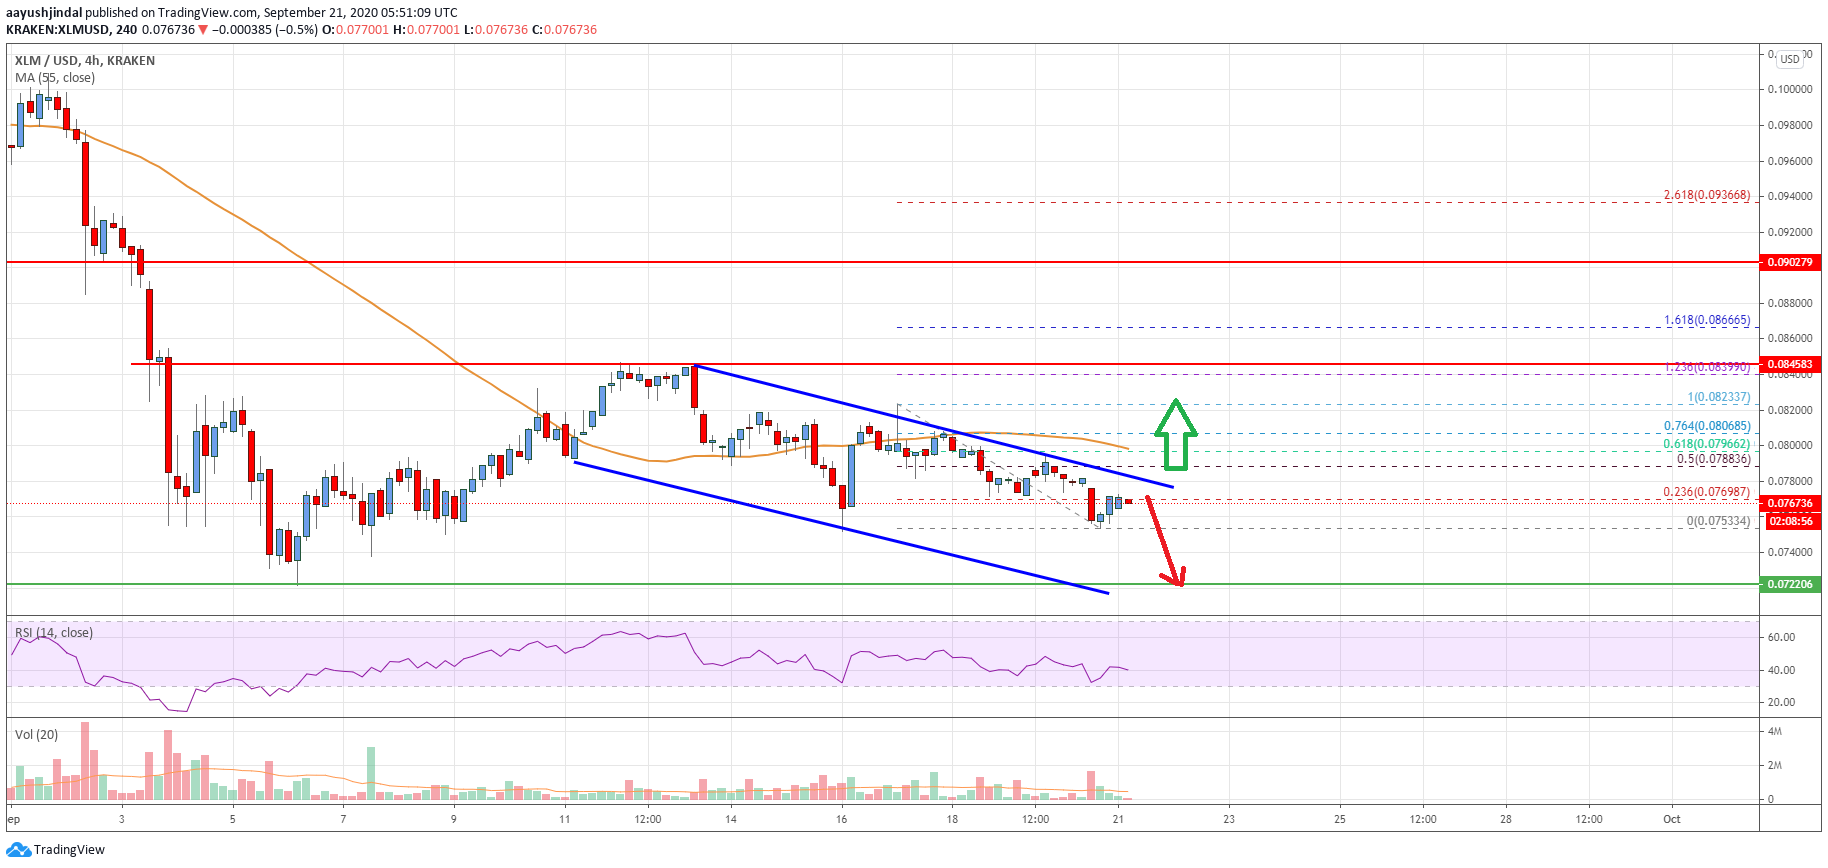
The chart indicates that XLM price clearly facing an uphill task near the $0.0780 and $0.0800 levels. Overall, the price could either nosedive below $0.0740 or it might correct above the $0.0800 resistance.
Technical Indicators
4 hours MACD – The MACD for XLM/USD is struggling to move back into the bullish zone.
4 hours RSI – The RSI for XLM/USD is currently declining and it is close to the 40 level.
Key Support Levels – $0.0750 and $0.0720.
Key Resistance Levels – $0.0780, $0.0800 and $0.0850.


Leave a Reply
You must be logged in to post a comment.