
- Stellar lumen price started a major decline from the $0.1020 resistance against the US Dollar.
- XLM price is now trading well below the $0.0825 support and the 55 simple moving average (4-hours).
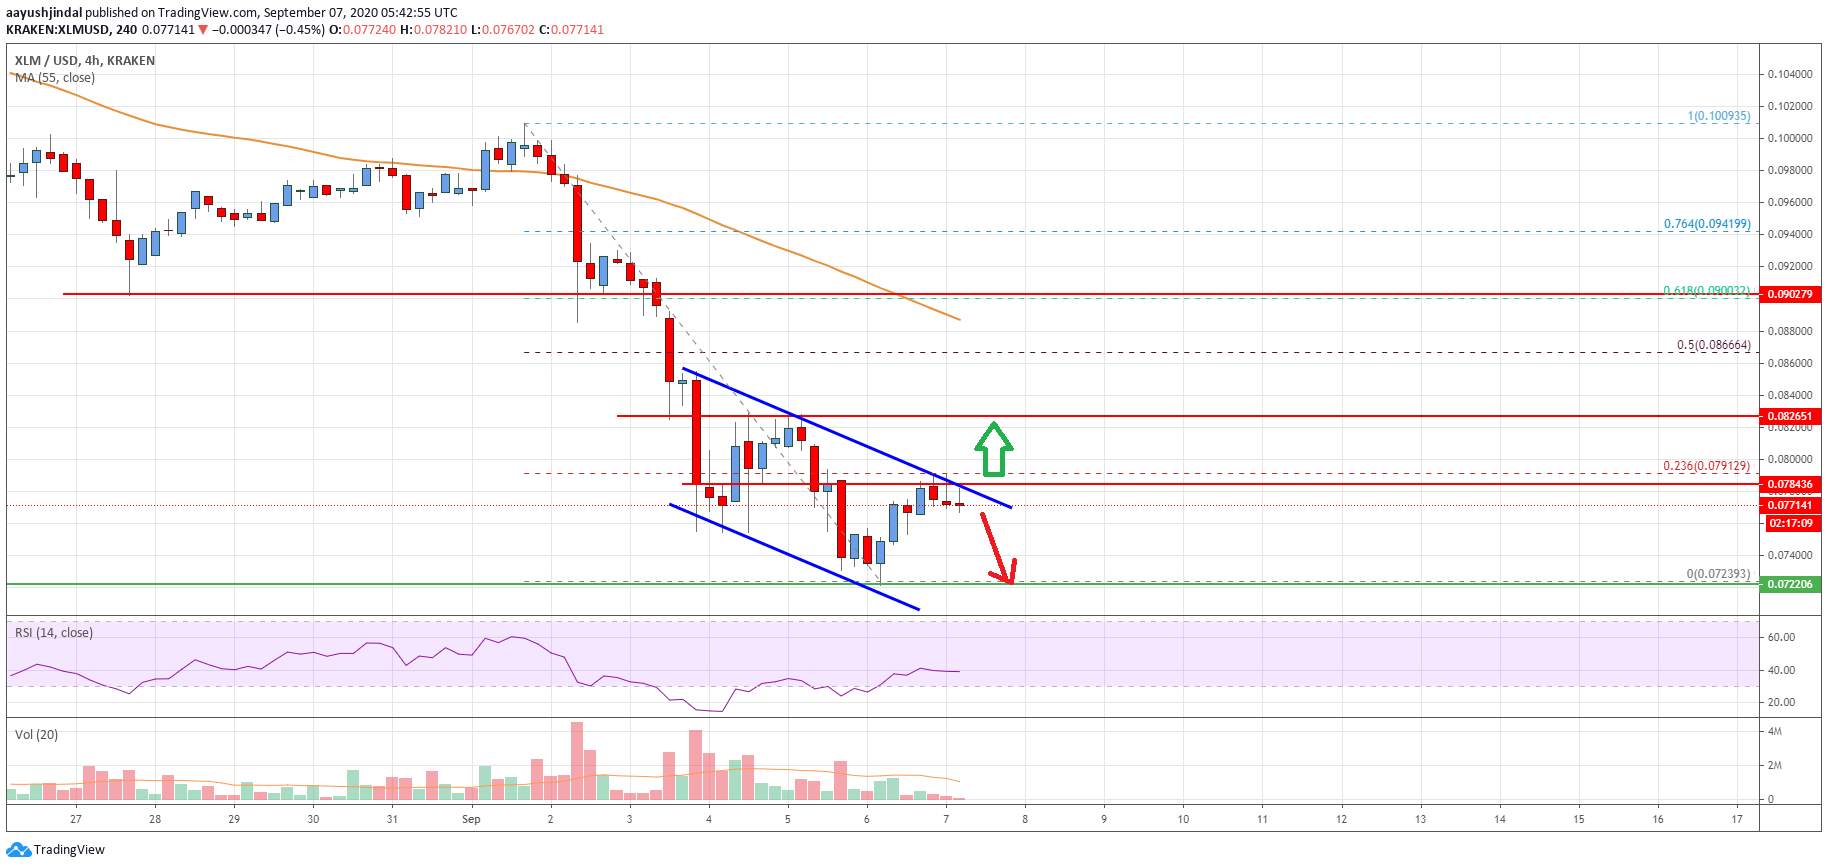
- There is a key declining channel forming with resistance near $0.0785 on the 4-hours chart (data feed via Kraken).
- The pair could start a decent recovery if it clears the $0.0800 and $0.0825 resistance levels.
Stellar lumen price is trading in a bearish zone below $0.0800 against the US Dollar, similar to bitcoin. XLM price might continue to move down unless it breaks the $0.0800 resistance.
Stellar Lumen Price Analysis (XLM to USD)
This past week, stellar lumen price started a strong decline from well above $0.1000 against the US Dollar. The XLM/USD pair even traded below the $0.0825 support level to move into a bearish zone.
Finally, the price broke the $0.0750 level and traded to a new monthly low at $0.0723. It is currently correcting higher above $$0.0750, but it is well below the 55 simple moving average (4-hours). At the moment, the price is facing hurdles near the $0.0790 level.
There is also a key declining channel forming with resistance near $0.0785 on the 4-hours chart. The declining channel coincides with the 23.6% Fibonacci retracement level of the downward move from the $0.1009 high to $0.0723 low.
If there is an upside break above the channel resistance, the price could recover towards the $0.0825 resistance. The next major resistance is near the $0.0850 and $0.0865 levels. The 50% Fibonacci retracement level of the downward move from the $0.1009 high to $0.0723 low is also near the $0.0865 level.
Any further gains could lead the price back towards the $0.1000 level. Conversely, the price might continue to move down below the $0.0750 support. In the stated case, it could decline towards the $0.0720 support.
The main support is near the $0.0700 level, below which the price might continue to decline towards $0.0660 support zone.
The chart indicates that XLM price is clearly attempting an upside break above $0.0800. Overall, the price could start a decent recovery if it clears the $0.0800 and $0.0825 resistance levels.
Technical Indicators
4 hours MACD – The MACD for XLM/USD is struggling to move back into the bullish zone.
4 hours RSI – The RSI for XLM/USD is currently declining and it is just below the 40 level.
Key Support Levels – $0.0750 and $0.0720.
Key Resistance Levels – $0.0800, $0.0825 and $0.0865.


Leave a Reply
You must be logged in to post a comment.