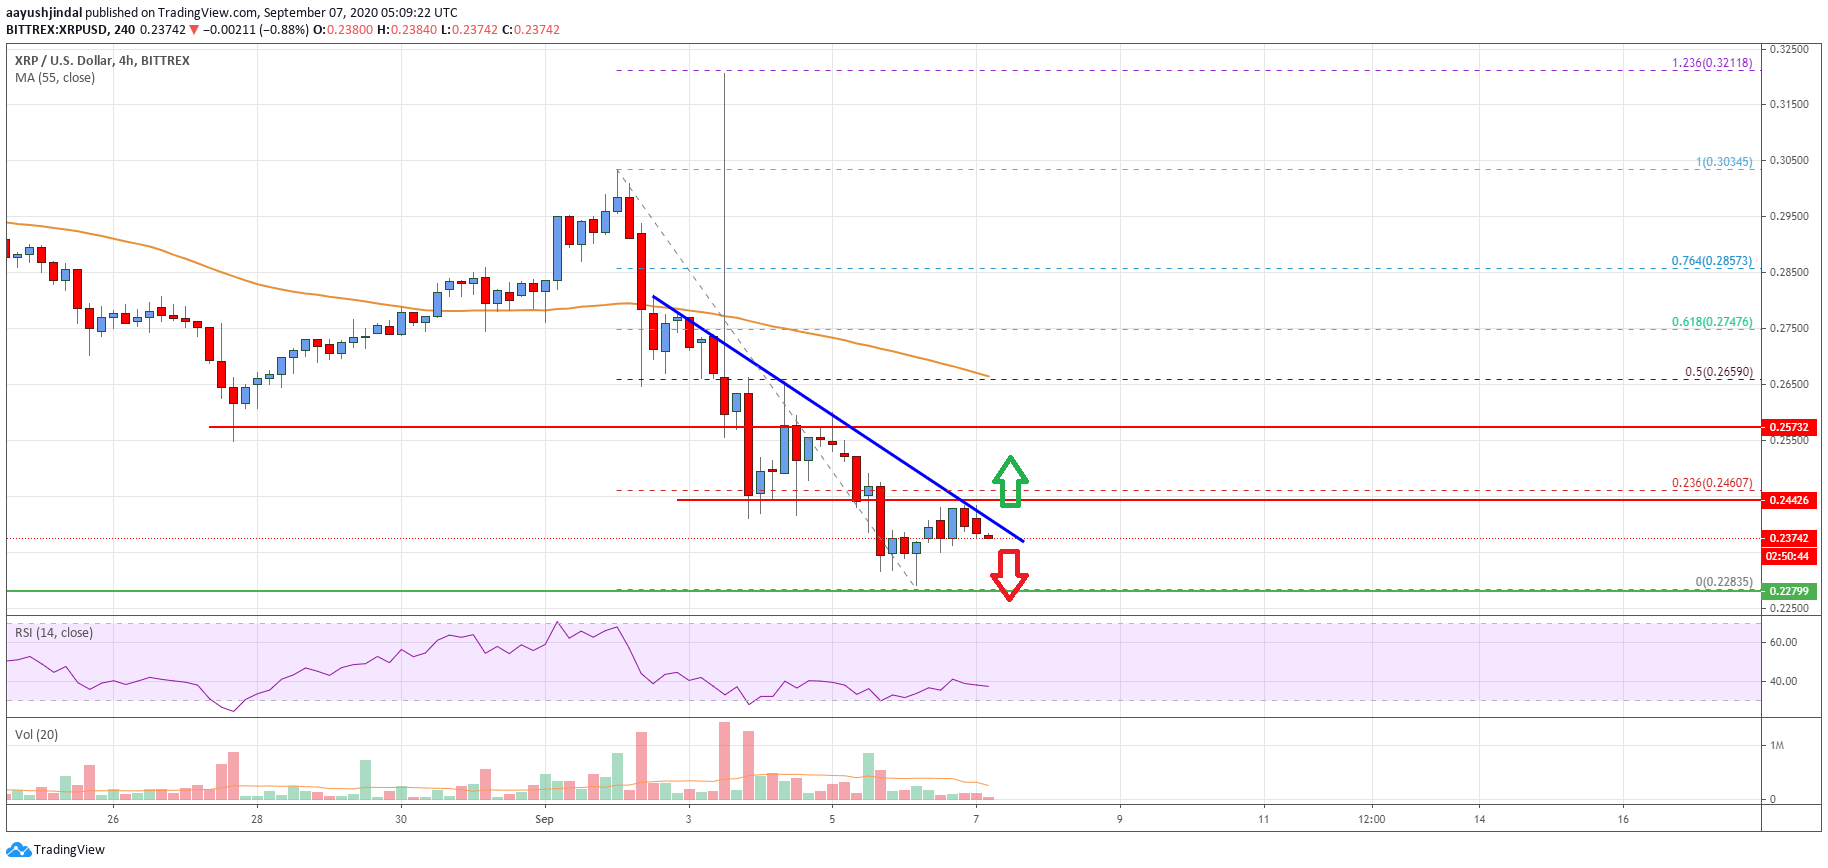
- Ripple price started a strong decline from well above the $0.2750 level against the US dollar.
- The price is currently trading well below the $0.2500 level and the 55 simple moving average (4-hours).
- There is a crucial bearish trend line forming with resistance near $0.2390 on the 4-hours chart of the XRP/USD pair (data source from Bittrex).
- The pair is likely to continue lower below $0.2280 as long as it is below $0.2450.
Ripple price is trading in a bearish zone below $0.2500 against the US Dollar. XRP price could continue to decline unless the bulls push it above $0.2450 and $0.2500.
Ripple Price Analysis
After forming a top near the $0.3050 level, ripple price started a strong decline against the US Dollar. The XRP/USD pair broke many supports near $0.2850 and $0.2750 to move into a bearish zone.
The decline gathered pace below the $0.2600 support and the 55 simple moving average (4-hours). The price even broke the $0.2500 support and traded to a new monthly low at $0.2283. It is currently consolidating losses above the $0.2280 support.
An initial resistance is near the $0.2440 level and the 23.6% Fib retracement level of the downward move from the $0.3034 high to $0.2283 low. There is also a crucial bearish trend line forming with resistance near $0.2390 on the 4-hours chart of the XRP/USD pair.
If there is an upside break above the trend line, the pair could recover towards the $0.2550 and $0.2570 resistance levels. The next major resistance is near the $0.2660 level or the 55 simple moving average (4-hours).
The 50% Fib retracement level of the downward move from the $0.3034 high to $0.2283 low is also near the $0.2660 level to act as a hurdle for the bulls. A successful break above the $0.2660 barrier is must to move back into a positive zone.
Conversely, the price might continue to move down below $0.2350. An initial support on the downside is near the $0.2300 level. The main support is now forming near the $0.2280 level, below which the price is likely to accelerate lower towards the $0.2200 level.

Looking at the chart, ripple price is clearly facing a couple of important hurdles near $0.2440 and $0.2550. Therefore, the price is likely to continue lower below $0.2280 as long as it is below $0.2450.
Technical indicators
4 hours MACD – The MACD for XRP/USD is still showing negative signs in the bearish zone.
4 hours RSI (Relative Strength Index) – The RSI for XRP/USD is currently below the 40 level.
Key Support Levels – $0.2300, $0.2280 and $0.2200.
Key Resistance Levels – $0.2440 and $0.2660.


Leave a Reply
You must be logged in to post a comment.