- Stellar lumen price started a downside correction from the $0.115 zone against the US Dollar.
- XLM price is now trading below $0.1050 and the 55 simple moving average (4 hours).
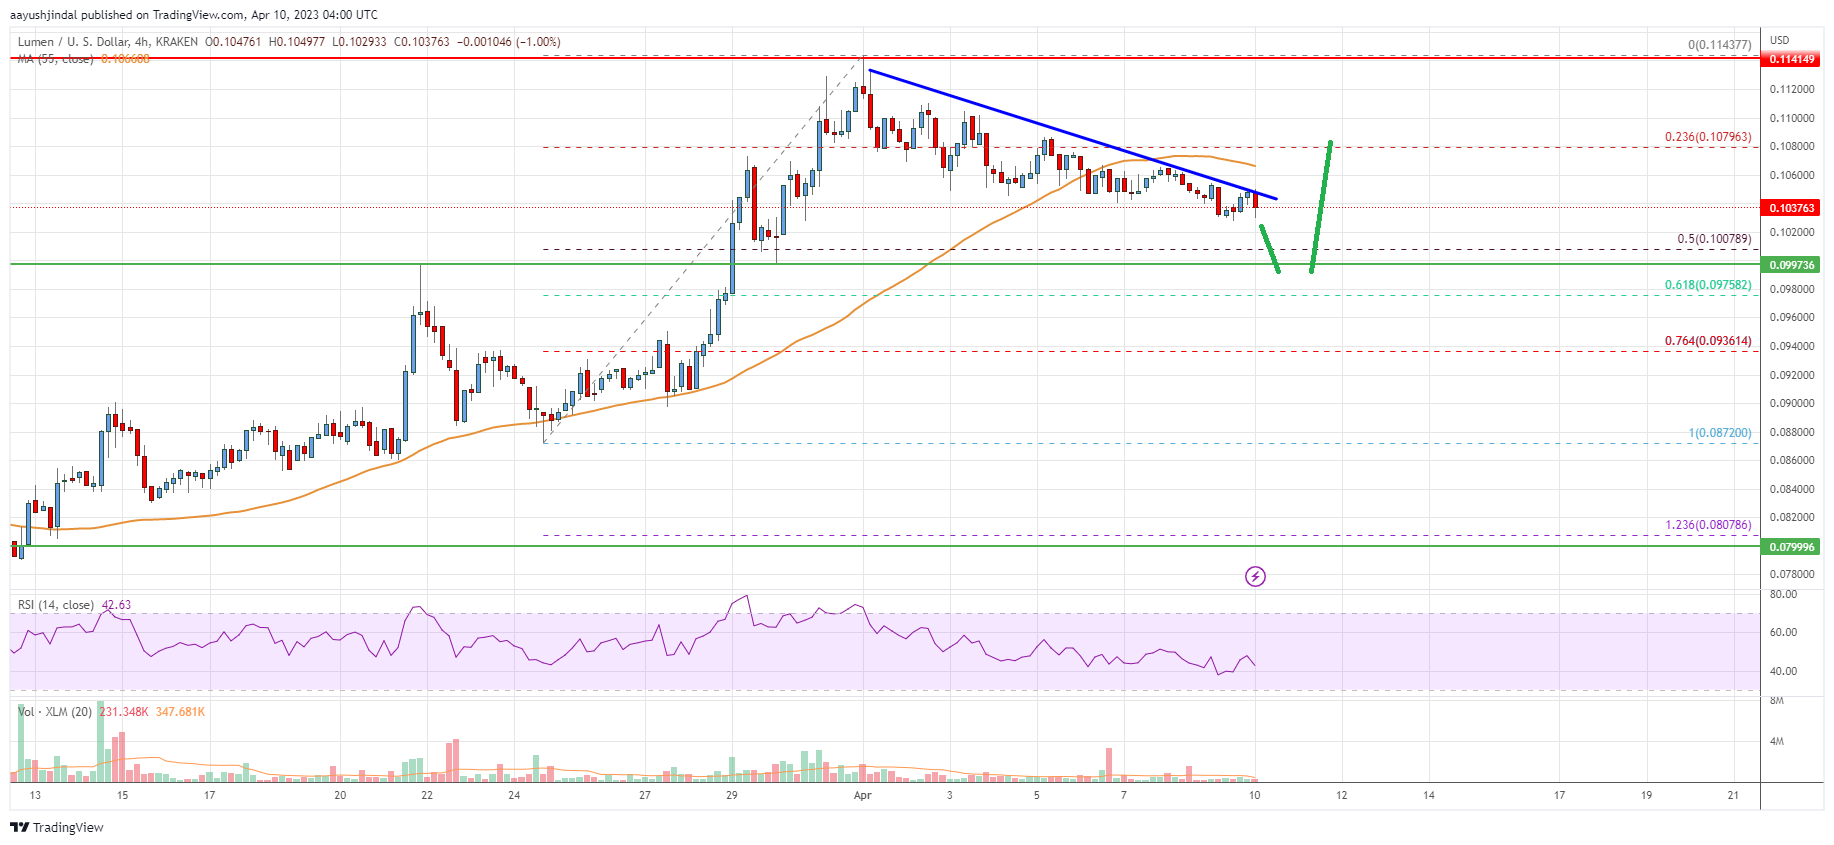
- There is a key bearish trend line forming with resistance near $0.1040 on the 4-hour chart (data feed via Kraken).
- The pair could start another increase if it clears the $0.1050 and $0.115 resistance levels.
Stellar lumen price is trading above $0.1000 against the US Dollar, similar to Bitcoin. XLM’s price must stay above the $0.0975 support to rise again.
Stellar Lumen Price Analysis (XLM to USD)
After forming a base above the $0.090 level, Stellar lumen price started a fresh increase against the US Dollar. The XLM/USD pair broke the $0.100 resistance zone to move into a positive zone.
The price even cleared the $0.1050 resistance and the 55 simple moving average (4 hours). The upward move was such that the price spike to $0.1120 before it corrected lower. There was a drop below the $0.1080 support level.
The bears pushed the price below the 23.6% Fib retracement level of the upward move from the $0.0872 swing low to the $0.1143 high. It is now trading below $0.1050 and the 55 simple moving average (4 hours). Initial support on the downside is near the $0.100 level.
The 50% Fib retracement level of the upward move from the $0.0872 swing low to the $0.1143 high is also near the $0.10 level. The next major support sits near the $0.0975 level. Any more losses could lead the price toward the $0.090 level in the near term.
On the upside, the price is facing resistance near the $0.105 zone. There is also a key bearish trend line forming with resistance near $0.1040 on the 4-hour chart.
The next major resistance is near the $0.1120 level. A clear move above the $0.1120 level might send the price toward the $0.1150 level. Any more gains could lead the price toward the $0.1200 level or even $0.1250 in the coming sessions.

The chart indicates that XLM’s price is now trading below $0.1120 and the 55 simple moving average (4 hours). Overall, the price could start another increase if it clears the $0.1050 and $0.115 resistance levels.
Technical Indicators
4 hours MACD – The MACD for XLM/USD is losing momentum in the bullish zone.
4 hours RSI – The RSI for XLM/USD is now below the 50 level.
Key Support Levels – $0.100 and $0.0975.
Key Resistance Levels – $0.1050, $0.1120, and $0.1150.


Leave a Reply
You must be logged in to post a comment.