- Tron price started a fresh increase from the $0.0645 level against the US Dollar.
- TRX price is now trading below $0.0750 and the 55 simple moving average (4 hours).
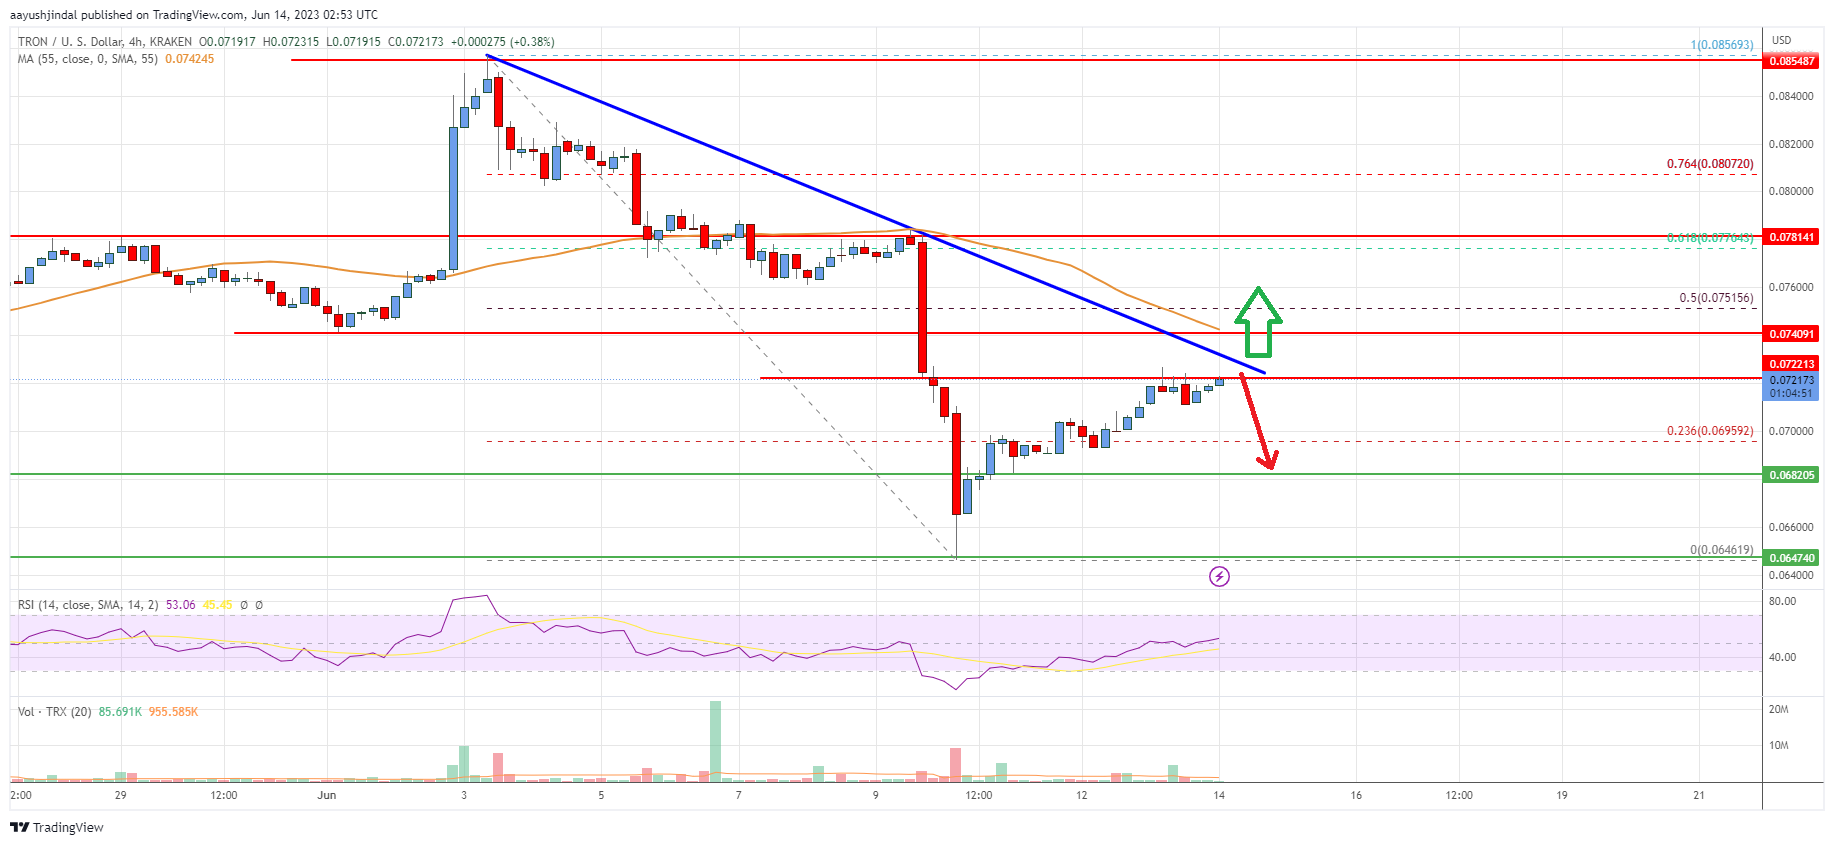
- There is a major bearish trend line forming with resistance near $0.0728 on the 4-hours chart (data feed via Kraken).
- The pair could continue to move up if it breaks the $0.074 resistance zone.
TRON price started a fresh increase above $0.0645 against the US Dollar, similar to Bitcoin. TRX’s price could rise further if it clears the $0.074 resistance.
Tron Price Analysis
After a downside correction, Tron price found support near the $0.0645 zone against the US Dollar. TRX’s price formed a base and recently started a fresh increase from the $0.0646 low.
There was a break above the $0.0680 and $0.0700 levels. The price climbed above the 23.6% Fib retracement level of the downward move from the $0.0856 swing high to the $0.0646 low. TRX is now trading below $0.075 and the 55 simple moving average (4 hours).
On the upside, TRX is facing resistance near the $0.0725 level. There is also a major bearish trend line forming with resistance near $0.0725 on the 4-hours chart.
The next major resistance is near the $0.074 level and the 55 simple moving average (4 hours). It is close to the 50% Fib retracement level of the downward move from the $0.0856 swing high to the $0.0646 low. A close above $0.074 could send the price toward the $0.0780 resistance zone.
Any more gains might send TRX price toward $0.080, above which the price could even rise toward $0.082. On the downside, initial support is near the $0.070 level. The next major support is now forming near $0.0682.
If there is a downside break below the $0.0682 support, the price might revisit the $0.0645 support. Any more losses might call for a move toward the $0.0620 zone in the near term.

The chart indicates that TRX’s price is now trading below $0.075 and the 55 simple moving average (4 hours). Overall, the price could continue to move up if it breaks the $0.074 resistance zone.
Technical Indicators
4 hours MACD – The MACD for TRX/USD is now gaining momentum in the bullish zone.
4 hours RSI – The RSI for TRX/USD is above the 50 level.
Key Support Levels – $0.070 and $0.0682.
Key Resistance Levels – $0.0728, $0.074, and $0.078.


Leave a Reply
You must be logged in to post a comment.