- Tron price traded below the $0.0500 zone before it started a decent recovery against the US Dollar.
- TRX price is now trading well below $0.0600 and the 55 simple moving average (4-hours).
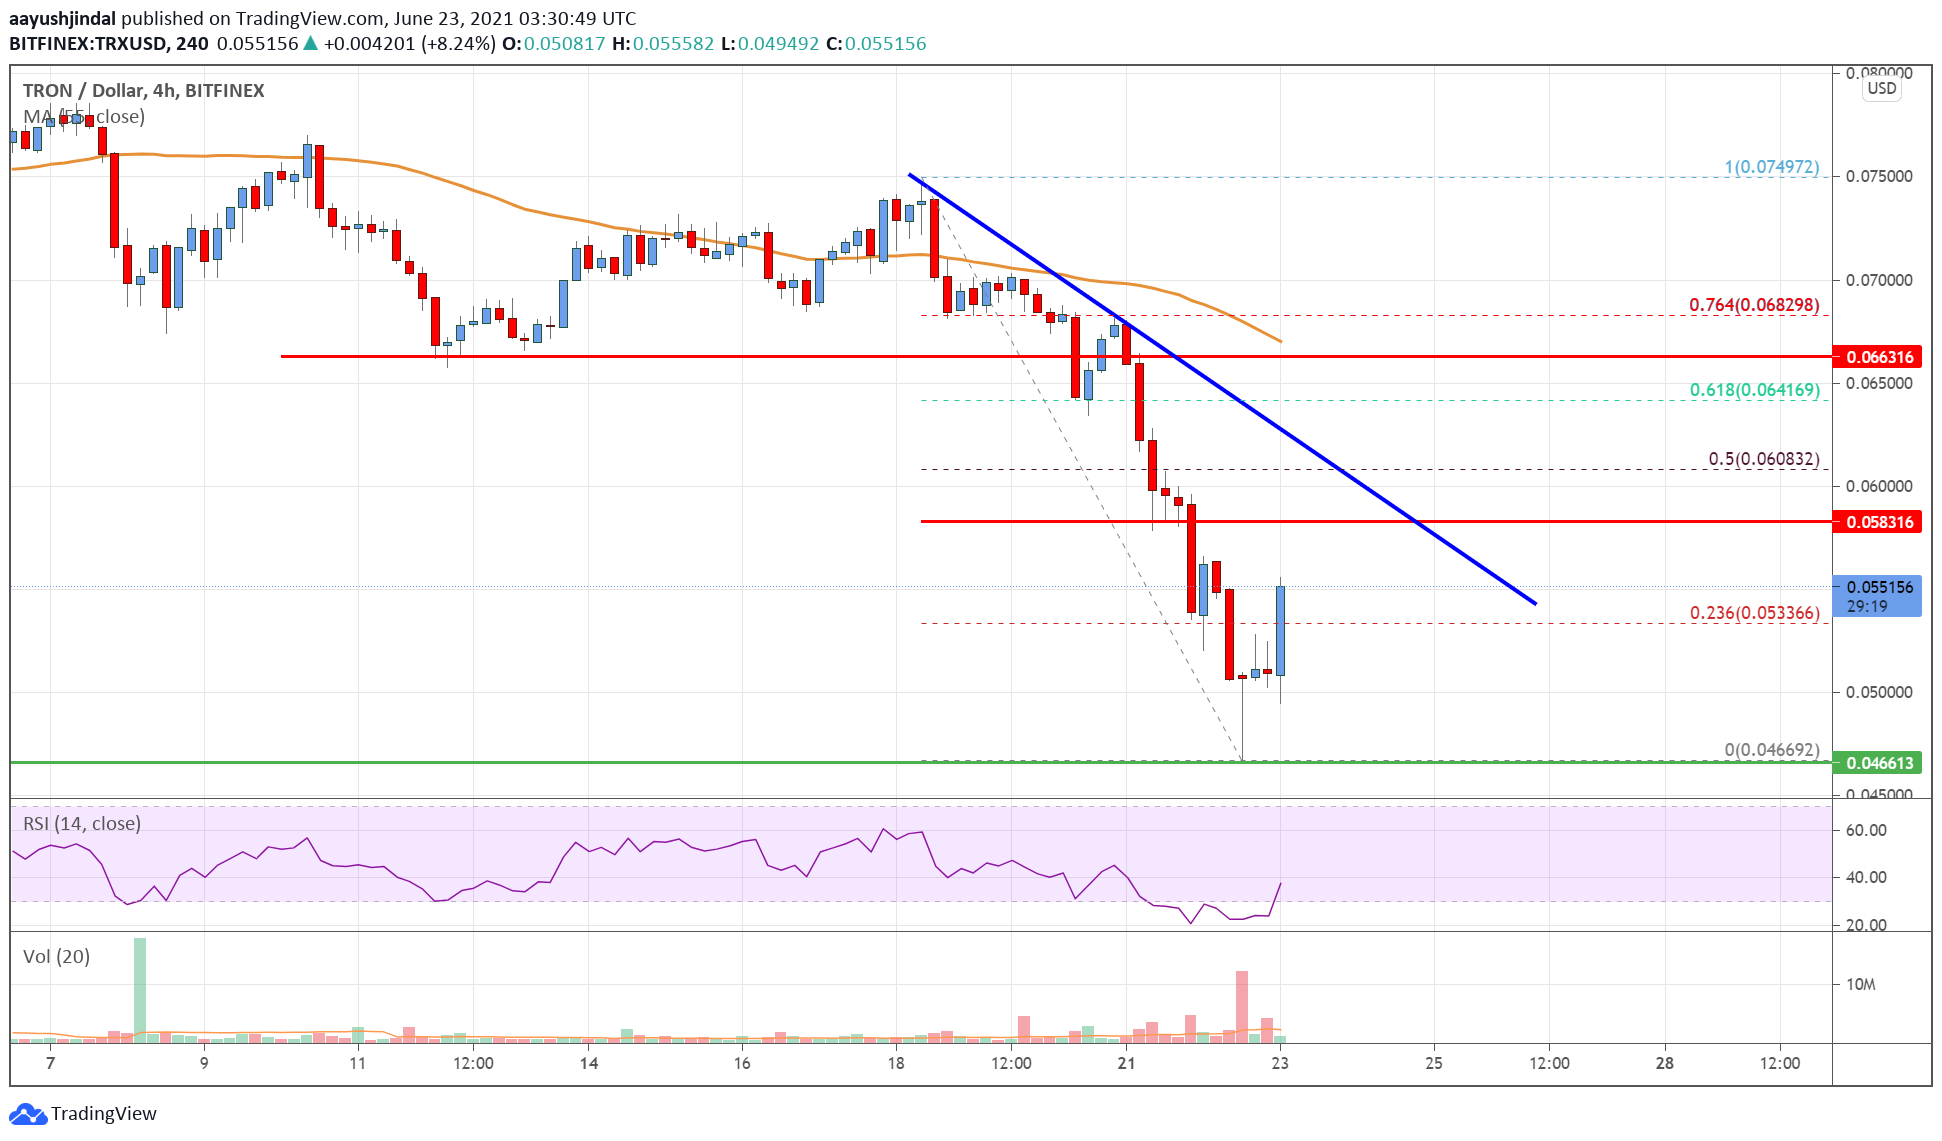
- There is a connecting bearish trend line forming with resistance near $0.0580 on the 4-hours chart (data feed via Bitfinex).
- The pair could start a major recovery if there is a clear break above $0.0580 and $0.0600.
TRON price is slowly recovering above $0.0500 against the US Dollar, similar to bitcoin. TRX price must surpass $0.0580 and $0.0600 to start a steady increase.
Tron Price Analysis
There was a downside extension in tron price below the $0.0600 level against the US Dollar. TRX price even broke the $0.0550 support level and the 55 simple moving average (4-hours).
It traded as low as $0.0466 and it is now correcting higher. There was a break above the $0.0500 resistance zone. The price climbed above the 23.6% Fib retracement level of the recent drop from the $0.0749 swing high to $0.0466 low.
However, it is still trading well below $0.0600 and the 55 simple moving average (4-hours). There is also a connecting bearish trend line forming with resistance near $0.0580 on the 4-hours chart.
The main resistance is now forming near the $0.0600 level. It is near the 50% Fib retracement level of the recent drop from the $0.0749 swing high to $0.0466 low. A clear upside break above $0.0580 and $0.0600 could open the doors for a sharp increase. The next major resistance is near $0.0660, above which the price could revisit $0.0700.
On the downside, an immediate support is near the $0.0520 level. The next key support is near the $0.0500 level, below which there is a risk of a drop towards the $0.0450 support. Any more losses could set the pace for a move towards the $0.0400 level in the near term.
The chart indicates that TRX price is still trading well below the $0.0600 zone and the 55 simple moving average (4-hours). Overall, the price could start a major increase if there is a clear break above $0.0580 and $0.0600.
Technical Indicators
4 hours MACD – The MACD for TRX/USD is slowly gaining momentum in the bullish zone.
4 hours RSI – The RSI for TRX/USD is still well below the 50 level.
Key Support Levels – $0.0520 and $0.0500.
Key Resistance Levels – $0.0580, $0.0600 and $0.0660.
