
- Tron price started a downside correction after trading as high as $0.0267 against the US Dollar.
- TRX price is currently just above $0.0250 and the 55 simple moving average (4-hours).
- There is a major contracting triangle forming with resistance at $0.0252 on the 4-hours chart (data feed via Bitfinex).
- The pair is likely to start a strong increase if there is a clear break above $0.0252 and $0.0255.
TRON price is currently consolidating above a key support against the US Dollar, similar to bitcoin above $15K. TRX price could either rally above $0.0260 or it might drop towards $0.0230.
Tron Price Analysis
TRON price started a strong increase from the $0.0230 support zone against the US Dollar. TRX price gained pace above the $0.0240 resistance and settled well above the 55 simple moving average (4-hours).
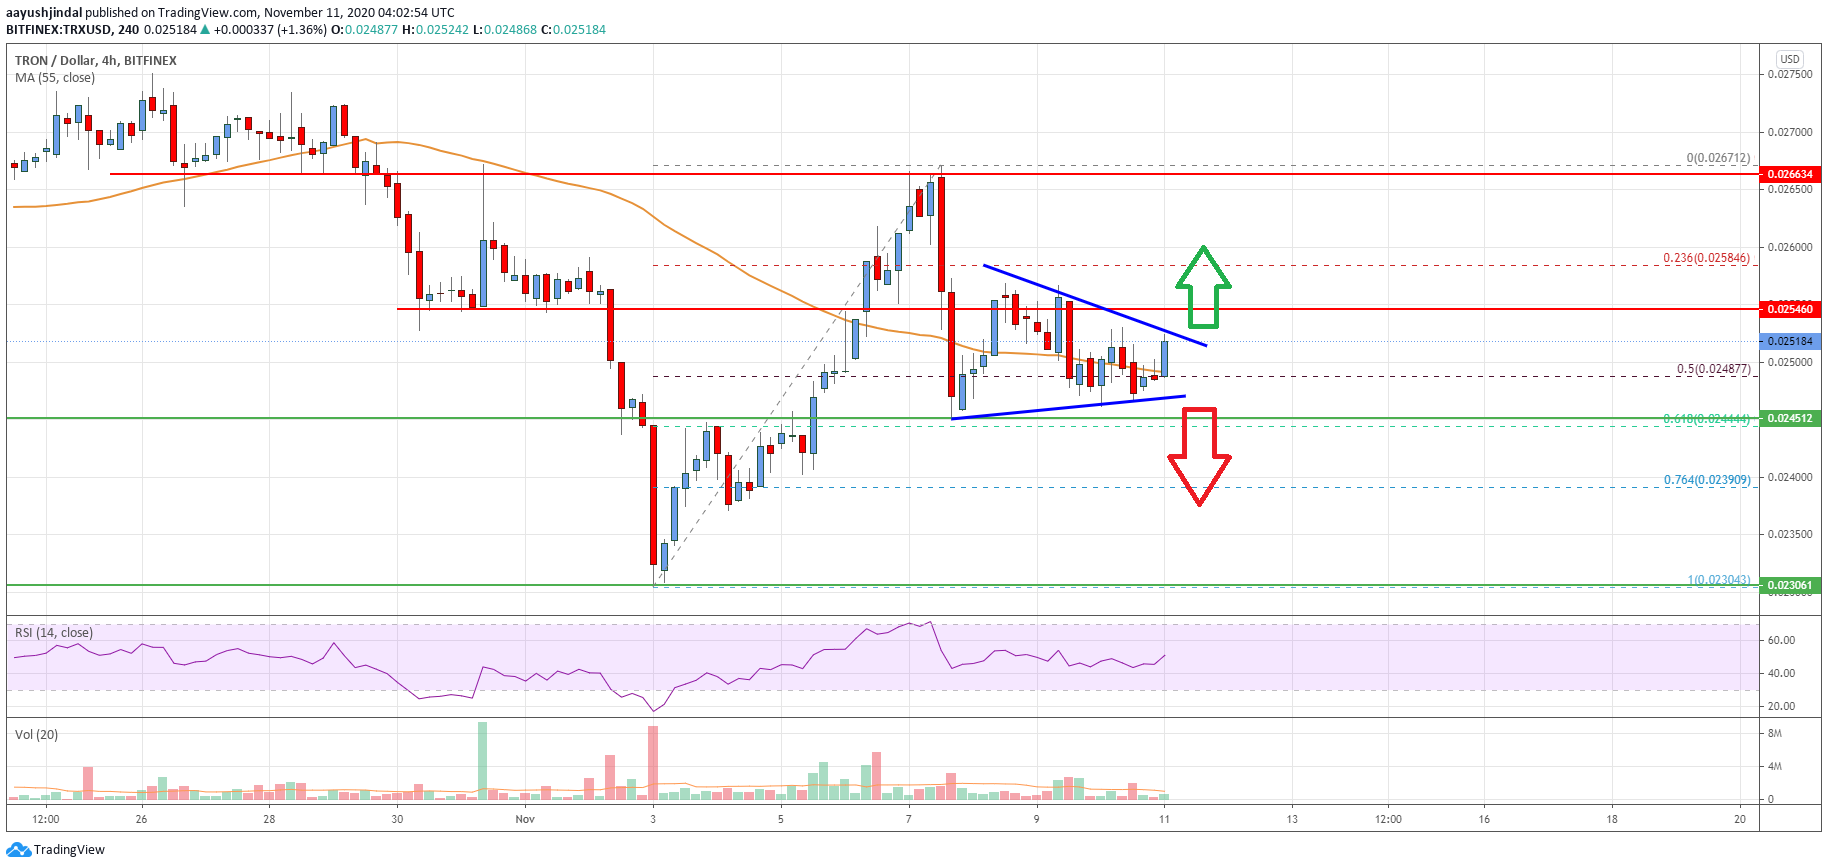
The price even broke the $0.0250 resistance zone. A high was formed near $0.0267 before the price started a downside correction. There was a break below the $0.0260 and $0.0250 levels. The price even traded below the 50% Fib retracement level of the upward move from the $0.0230 low to $0.0267 high.
However, the price remained well bid above the $0.0245 level. The 61.8% Fib retracement level of the upward move from the $0.0230 low to $0.0267 high is also acting as a strong support.
It seems like there is a major contracting triangle forming with resistance at $0.0252 on the 4-hours chart. The bulls are likely to gain strength if there is a clear break above the triangle resistance and then $0.0.255. The next major resistance is near $0.0262, above which tron price might surge towards the $0.0280 level.
Conversely, the price might resume its decline below the triangle support at $0.0248 level. The next major support is near $0.0240 zone, below which the price is likely to revisit the $0.0230 support. Any further losses could lead the price towards the $0.0212 and $0.0210 support levels.
The chart indicates that TRX price clearly preparing for the next move with a key hurdle near $0.0255. Overall, the price is likely to start a fresh increase if there is a clear break above the $0.0255 resistance zone.
Technical Indicators
4 hours MACD – The MACD for TRX/USD is losing pace in the bearish zone.
4 hours RSI – The RSI for TRX/USD is rising and it is likely to clear the 50 level.
Key Support Levels – $0.0245 and $0.0230.
Key Resistance Levels – $0.0252, $0.0255 and $0.0262.


Leave a Reply
You must be logged in to post a comment.