- Tron price is currently recovering and is trading above the $0.0150 resistance against the US Dollar.
- TRX price is facing a few key hurdles near the $0.0162 and $0.0165 levels.
- There was a break above a crucial bearish trend line with resistance near $0.0156 on the 4-hours chart (data feed via Bitfinex).
- The price is likely to gain bullish momentum once it surpasses the $0.0162 and $0.0165 resistance levels.
TRON price is showing positive signs against the US Dollar and bitcoin. TRX price could recover significantly if it settles above the $0.0165 resistance area.
Tron Price Analysis
Earlier this month, TRON price traded to a new multi-week low near the $0.0140 level against the US Dollar. Later, the price recovered sharply above the $0.0150 level and the 55 simple moving average (4-hours). However, the upward move was capped by the $0.0162 level. Recently, there was a downside correction and the price traded as low as $0.0144. At the moment, the price is climbing higher and is trading above the $0.0150 level.
During the recent rise, there was a break above a crucial bearish trend line with resistance near $0.0156 on the 4-hours chart. The price traded as high as $0.0159 before correcting below $0.0158. It broke the 23.6% Fibonacci retracement level of the last wave from the $0.0144 low to $0.0159 high. However, the $0.0155 level and the 55 SMA are acting as strong supports.
The current price action is positive above the $0.0155 support. Having said that, there are two important hurdles for the bulls on the upside near $0.0162 and $0.0165. If there is a convincing break above the $0.0162 and $0.0165 resistance levels, the price could continue to rise. In the mentioned case, the price is likely to surge towards the $0.0180 and $0.0185 resistance levels.
Conversely, if there is fresh decline, the $0.0155 level and the 55 SMA might provide support. The main support is near the $0.0151 and $0.0150 levels, below which the price could again turn bearish. The next key supports are near the $0.0144 and $0.0140 levels.
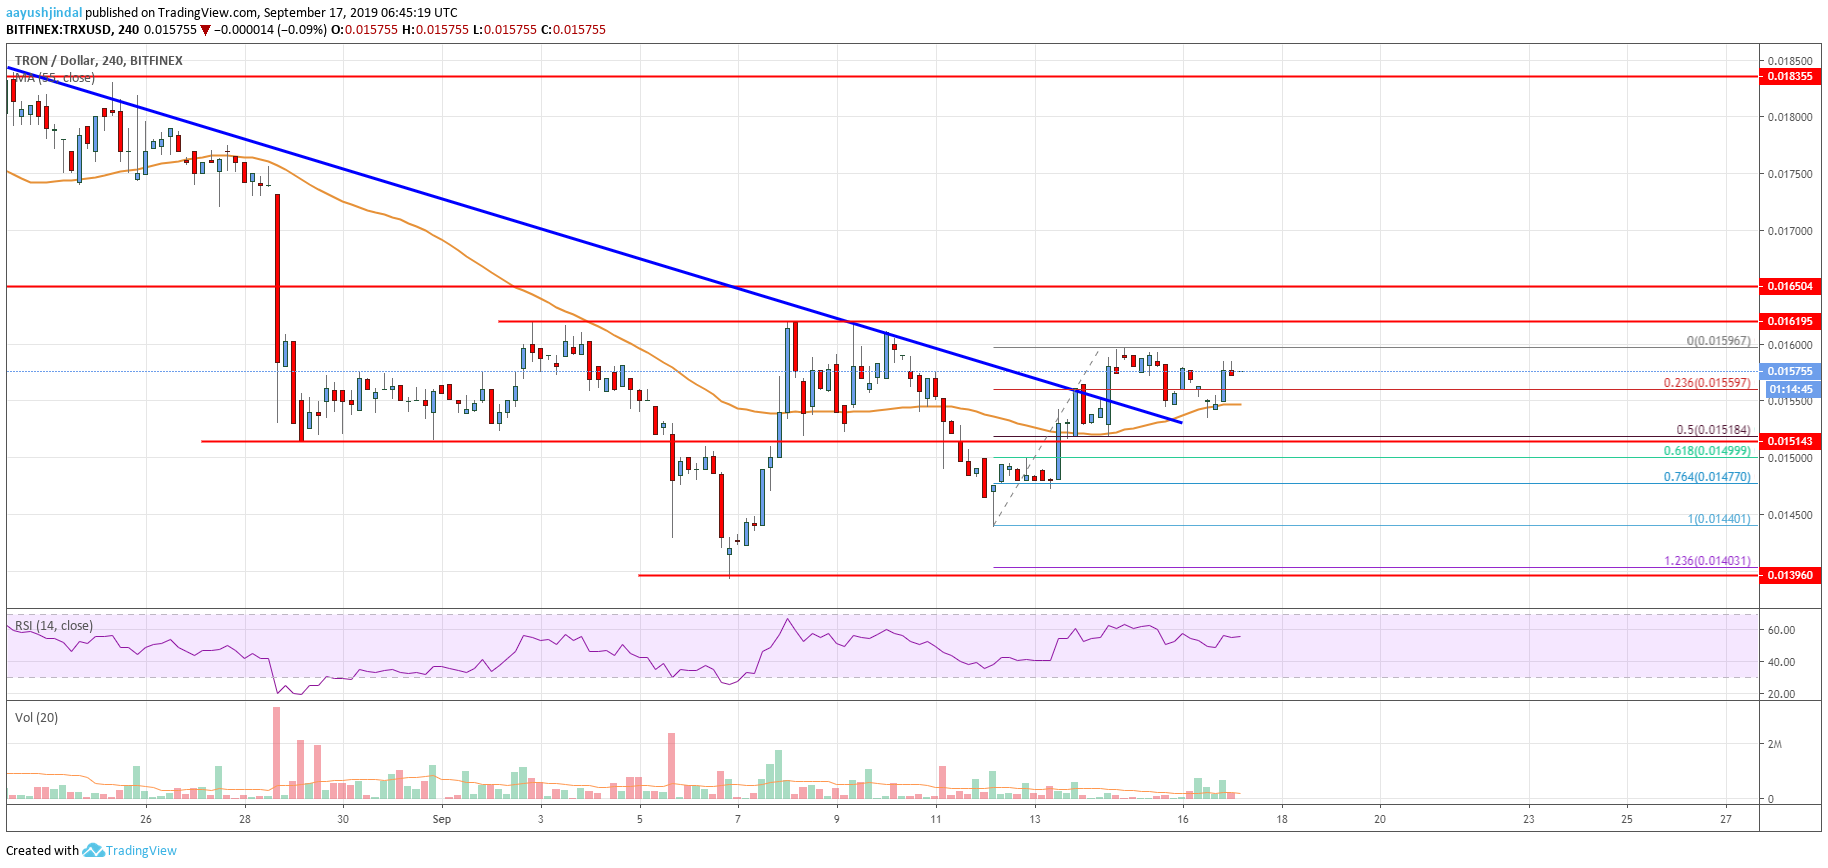
The chart indicates that TRX price is showing a few positive signs above the $0.0155 support area. However, the bulls might face a strong selling interest near $0.0162. If they succeed in gaining strength above $0.0162, the price will most likely surge above $0.0165. If they fail, the price could revisit $0.0150 or even $0.0144.
Technical Indicators
4 hours MACD – The MACD for TRX/USD is slowly gaining momentum in the bullish zone.
4 hours RSI – The RSI for TRX/USD is currently climbing higher and is well above the 50 level.
Key Support Levels – $0.0155 and $0.0150.
Key Resistance Levels – $0.0162, $0.0165 and $0.0180.