- Tron price traded to a new 2020 high at $0.0268 before correcting gains against the US Dollar.
- TRX price declined below the $0.0235 support and recently tested $0.0200.
- There was a break below a key bullish trend line with support near $0.0225 on the 4-hours chart (data feed via Bitfinex).
- The price is currently rising, but it is likely to face a strong resistance near $0.0235.
TRON price is likely to resume its upward move against the US Dollar, similar to bitcoin. However, TRX price must clear the $0.0235 resistance to continue higher.
Tron Price Analysis
This past week, TRON price extended its rally above the $0.0235 and $0.0240 resistance levels against the US Dollar. TRX price even climbed above the $0.0250 resistance and settled above the 55 simple moving average (4-hours).
Finally, the price traded to a new 2020 high at $0.0268 before correcting lower. There was a sharp decline below the $0.0250 and $0.0235 support levels. During the decline, the price broke the $0.0220 support and the 55 simple moving average (4-hours).
More importantly, there was a break below a key bullish trend line with support near $0.0225 on the 4-hours chart. The price tested the $0.0200 support area and a low is formed near $0.0201.
Tron price is currently rising and trading above the $0.0210 level. It surpassed the 23.6% Fibonacci retracement level of the downward move from the $0.0268 high to $0.0201 low.
However, there are many important hurdles waiting on the upside, starting with $0.0232. Besides, the 50% was a break below a key bullish trend line with support near $0.0225 on the 4-hours chart is near the $0.0235 resistance area along with the 55 simple moving average (4-hours).
Therefore, the bulls need to gain pace above the $0.0232 and $0.0235 resistance levels to continue higher in the near term. The next major resistance is near $0.0265.
Conversely, the price might fail to continue above the $0.0232 and $0.0235 resistance levels. In the mentioned case, the price could revisit the $0.0200 support. Any further losses may perhaps lead the price towards the $0.0180 support.
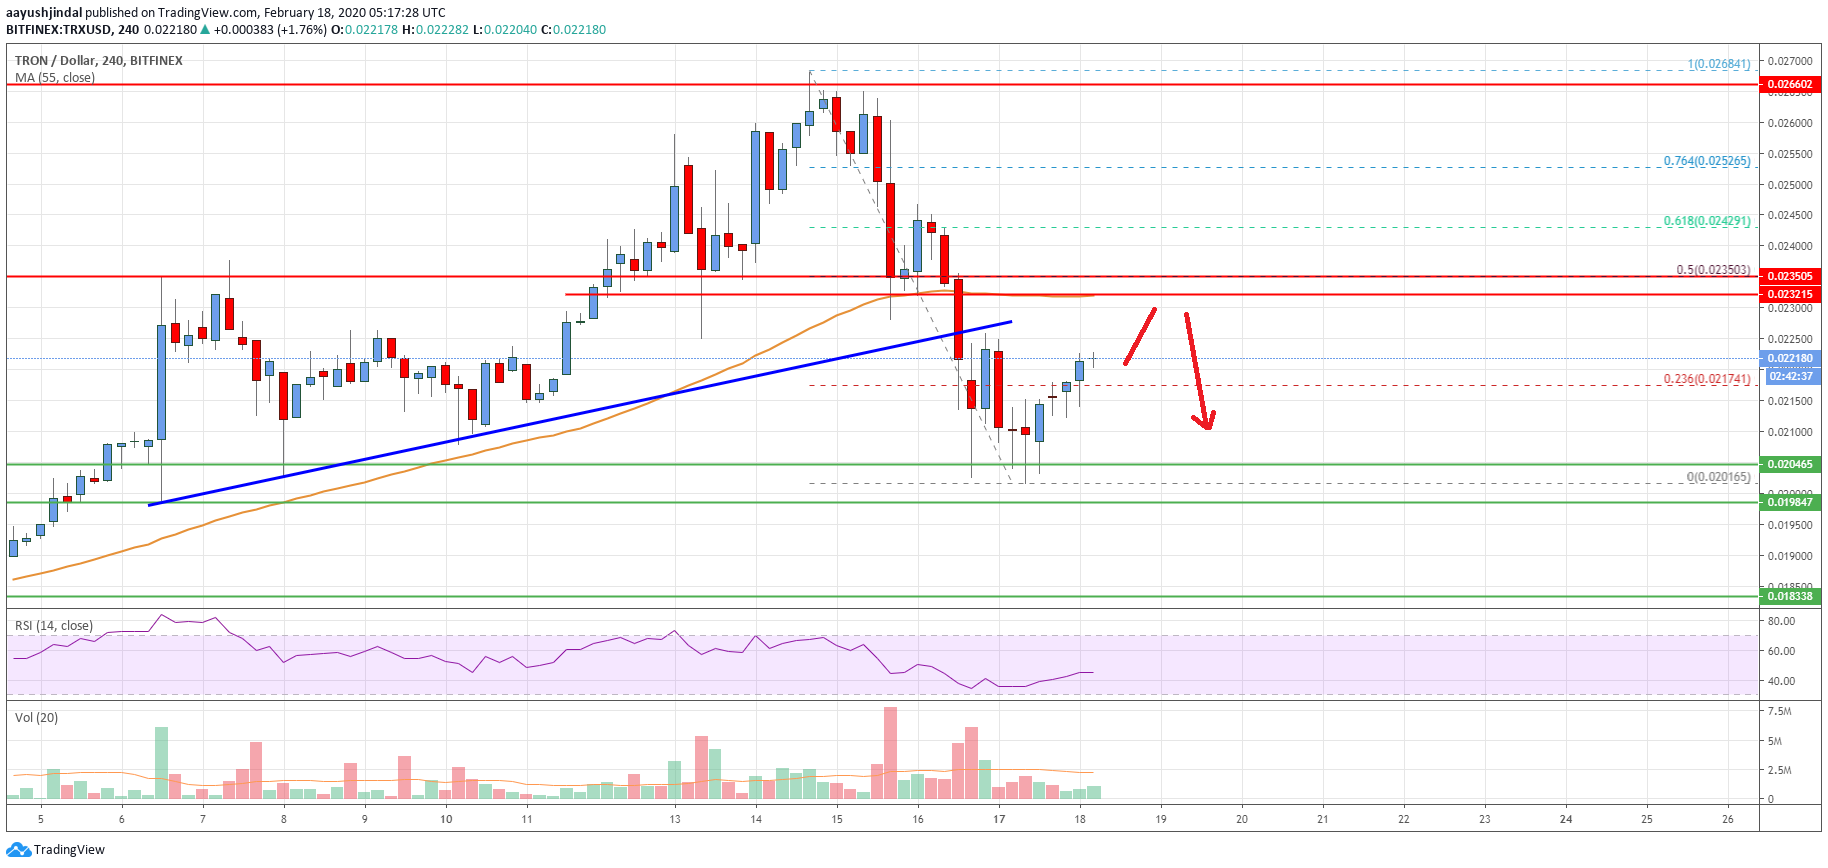
The chart indicates that TRX price is clearly rising from the $0.0200 support area. Having said that, the bulls need to gain pace for a push above $0.0235 for a fresh rally. If not, the price might dive below $0.0210 and $0.0200.
Technical Indicators
4 hours MACD – The MACD for TRX/USD is slowly gaining momentum in the bullish zone.
4 hours RSI – The RSI for TRX/USD is still below the 50 level.
Key Support Levels – $0.0210 and $0.0200.
Key Resistance Levels – $0.0232, $0.0235 and $0.0250.


Leave a Reply
You must be logged in to post a comment.