- Tron price is holding an important support near $0.0145 and correcting higher against the US Dollar.
- TRX price is facing a strong resistance near the $0.0162 and $0.0165 levels.
- There is a major bearish trend line forming with resistance near $0.0162 on the 4-hours chart (data feed via Bitfinex).
- The price is likely to rise steadily above the $0.0162 and $0.0165 levels in the near term.
TRON price is showing positive signs against the US Dollar and bitcoin. TRX price remains well supported and it could soon surpass the $0.0165 resistance.
Tron Price Analysis
This past week, TRON price climbed above the $0.0165 resistance area against the US Dollar. However, TRX price failed to continue above the $0.0168 resistance and later started a fresh decline.
There was a sharp decline below the $0.01650 and $0.0160 support levels. Moreover, there was a close below the $0.0155 level and the 55 simple moving average (4-hours). Finally, the price traded below the $0.0150 support area.
On the downside, the $0.0145 support area acted as a strong buy zone. A swing low was formed near $0.01435 and tron recently started an upside correction. It surpassed the $0.0150 resistance, plus the 23.6% Fibonacci retracement level of the last slide from the $0.0168 high to $0.0143 low.
At the moment, the price is facing resistance near the $0.0156 level and the 55 simple moving average (4-hours). Additionally, the 50% Fibonacci retracement level of the last slide from the $0.0168 high to $0.0143 low is preventing gains.
Above $0.0156, the next key resistance is near the $0.0160 level. More importantly, there is a major bearish trend line forming with resistance near $0.0162 on the 4-hours chart. A clear break above $0.0160 and the trend line is must for the bulls to take control. The next key resistance is near the $0.0165 level, above which the price could rally to $0.0168 and $0.0170.
On the downside, there is a decent support forming near $0.0150 and a connecting bullish trend line. The main support is near the $0.0145 level. A daily close below $0.0145 may perhaps accelerate losses in TRX below the $0.0140 level.
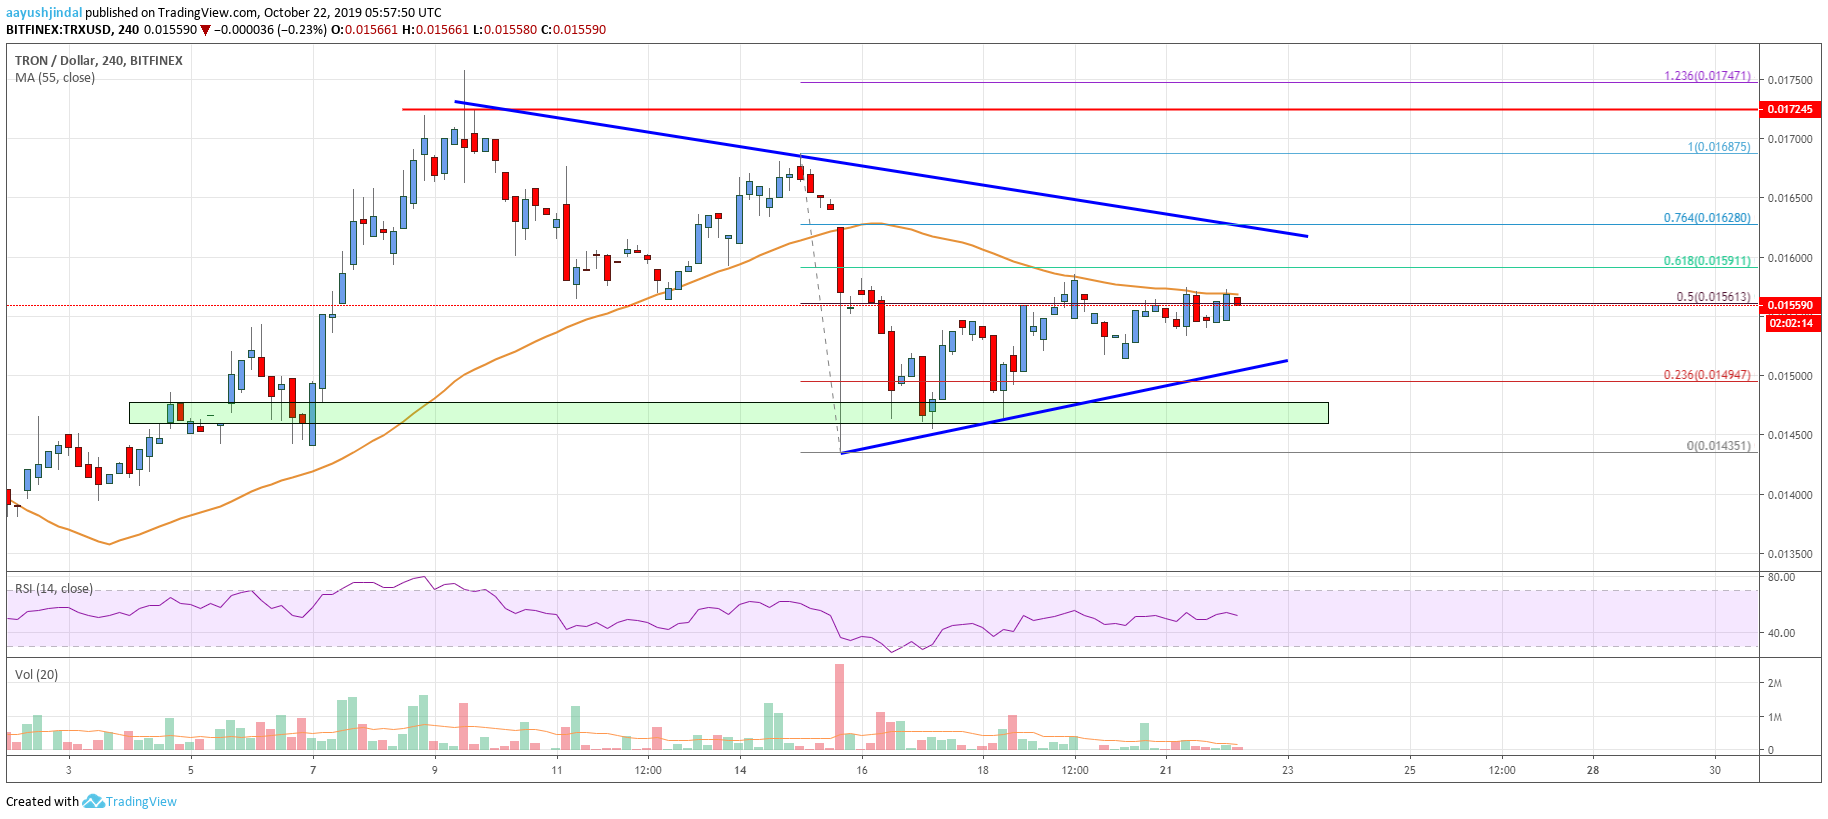
The chart indicates that TRX price is facing a lot of hurdles near the $0.0160 and $0.0162 levels. If there is a successful break above $0.0162, the price is likely to start a fresh increase. If not, there are chances of another drop to $0.0145.
Technical Indicators
4 hours MACD – The MACD for TRX/USD is slowly gaining momentum in to bullish zone.
4 hours RSI – The RSI for TRX/USD is currently just above the 50 level.
Key Support Levels – $0.0150 and $0.0145.
Key Resistance Levels – $0.0162, $0.0165 and $0.0168.