- Tron price failed to clear the $0.0360 resistance and declined below $0.0320 against the US Dollar.
- TRX price is now trading well below $0.0310 and the 55 simple moving average (4-hours).
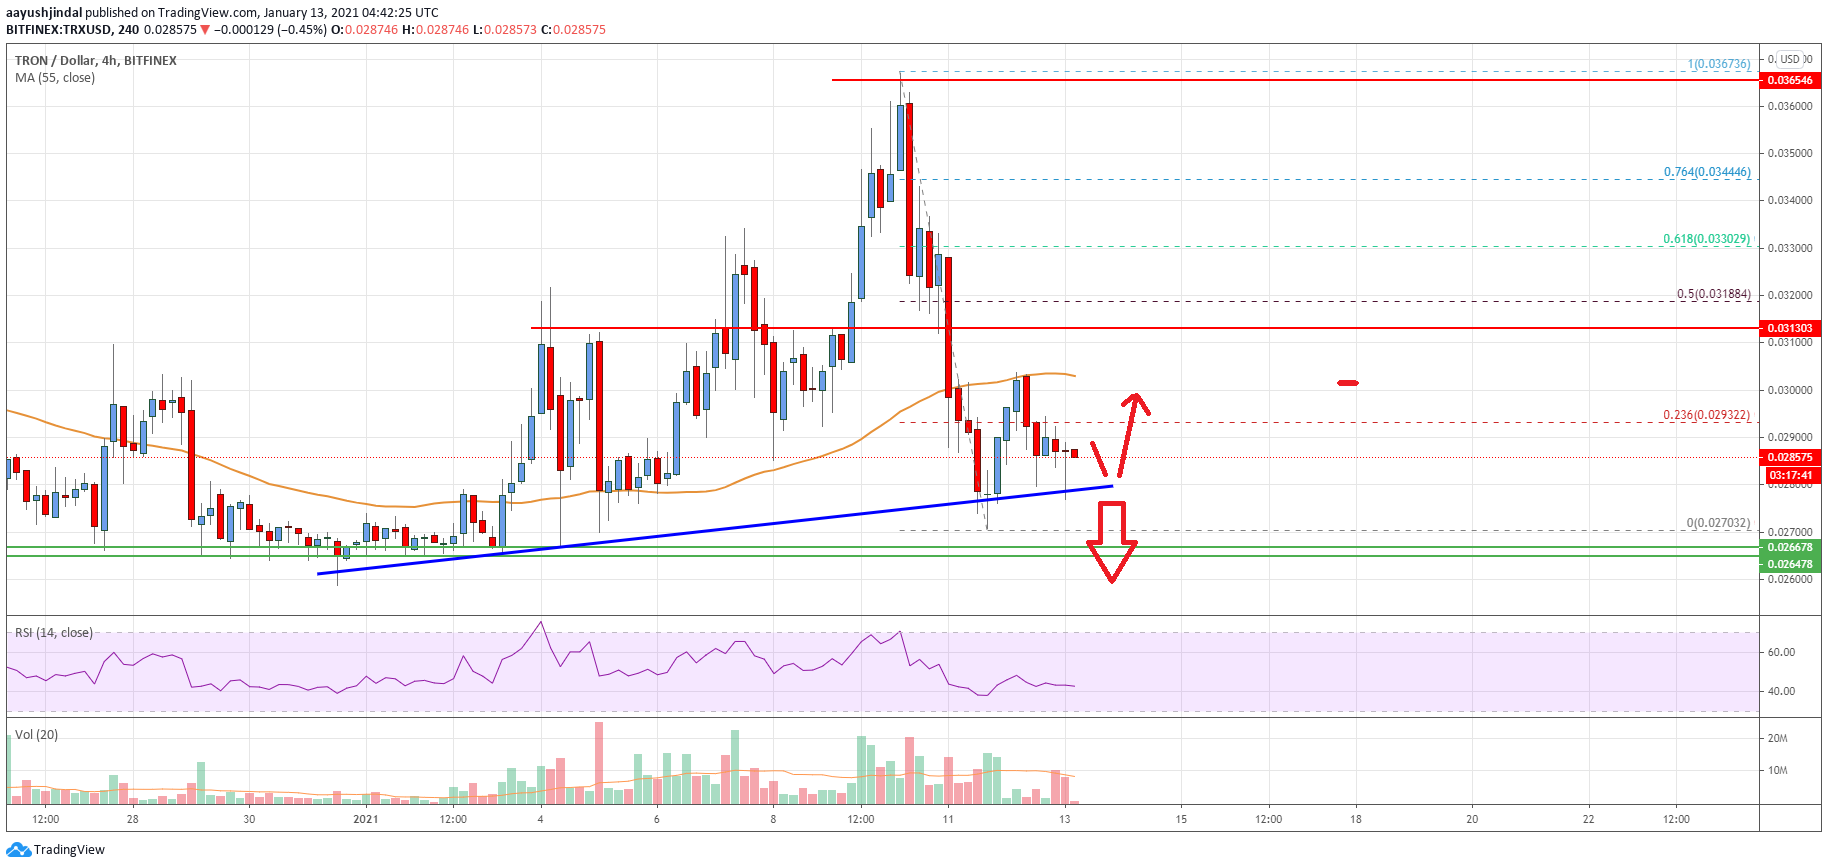
- There is a key bullish trend line forming with support near $0.0280 on the 4-hours chart (data feed via Bitfinex).
- The pair could start a major decline if it fails to stay above the $0.0280 and $0.0270 support levels.
TRON price is showing bearish signs below $0.0310 and $0.0320 against the US Dollar, similar to bitcoin. TRX price must stay above $0.0270 to start a fresh increase in the near term.
Tron Price Analysis
There was a steady increase in TRON price after it broke the $0.0320 resistance against the US Dollar. TRX price gained strength above the $0.0340 resistance and the 55 simple moving average (4-hours).
The price even spiked above the $0.0360 level, but it failed to continue higher. A fresh decline was initiated and the price broke the $0.0320 support zone. It even broke the $0.0312 support zone and settled below the 55 simple moving average (4-hours).
A low is formed near $0.0270 and the price is currently correcting higher. It broke the 23.6% Fib retracement level of the downward move from the $0.0376 high to $0.0270 low. There is also a key bullish trend line forming with support near $0.0280 on the 4-hours chart.
Tron price seems to be facing resistance near the $0.0300 level and the 55 simple moving average (4-hours). The first major resistance is near the $0.0312 level, followed by the 50% Fib retracement level of the downward move from the $0.0376 high to $0.0270 low.
To start a fresh increase, the price must clear the $0.0312 and $0.0320 resistance levels. The next major stop for the bulls could be $0.0345. Conversely, the price could break the trend support and the $0.0275 level.
The main support is near the $0.0270 level. A close below $0.0270 may possibly call for a strong decline towards the $0.0225 level.

The chart indicates that TRX price clearly showing bearish signs below $0.0320. Overall, the price could start a major decline if it fails to stay above the $0.0280 and $0.0270 support levels in the near term.
Technical Indicators
4 hours MACD – The MACD for TRX/USD is slowly losing momentum in the bearish zone.
4 hours RSI – The RSI for TRX/USD is now below the 50 level.
Key Support Levels – $0.0280 and $0.0270.
Key Resistance Levels – $0.0300, $0.0312 and $0.0320.


Leave a Reply
You must be logged in to post a comment.