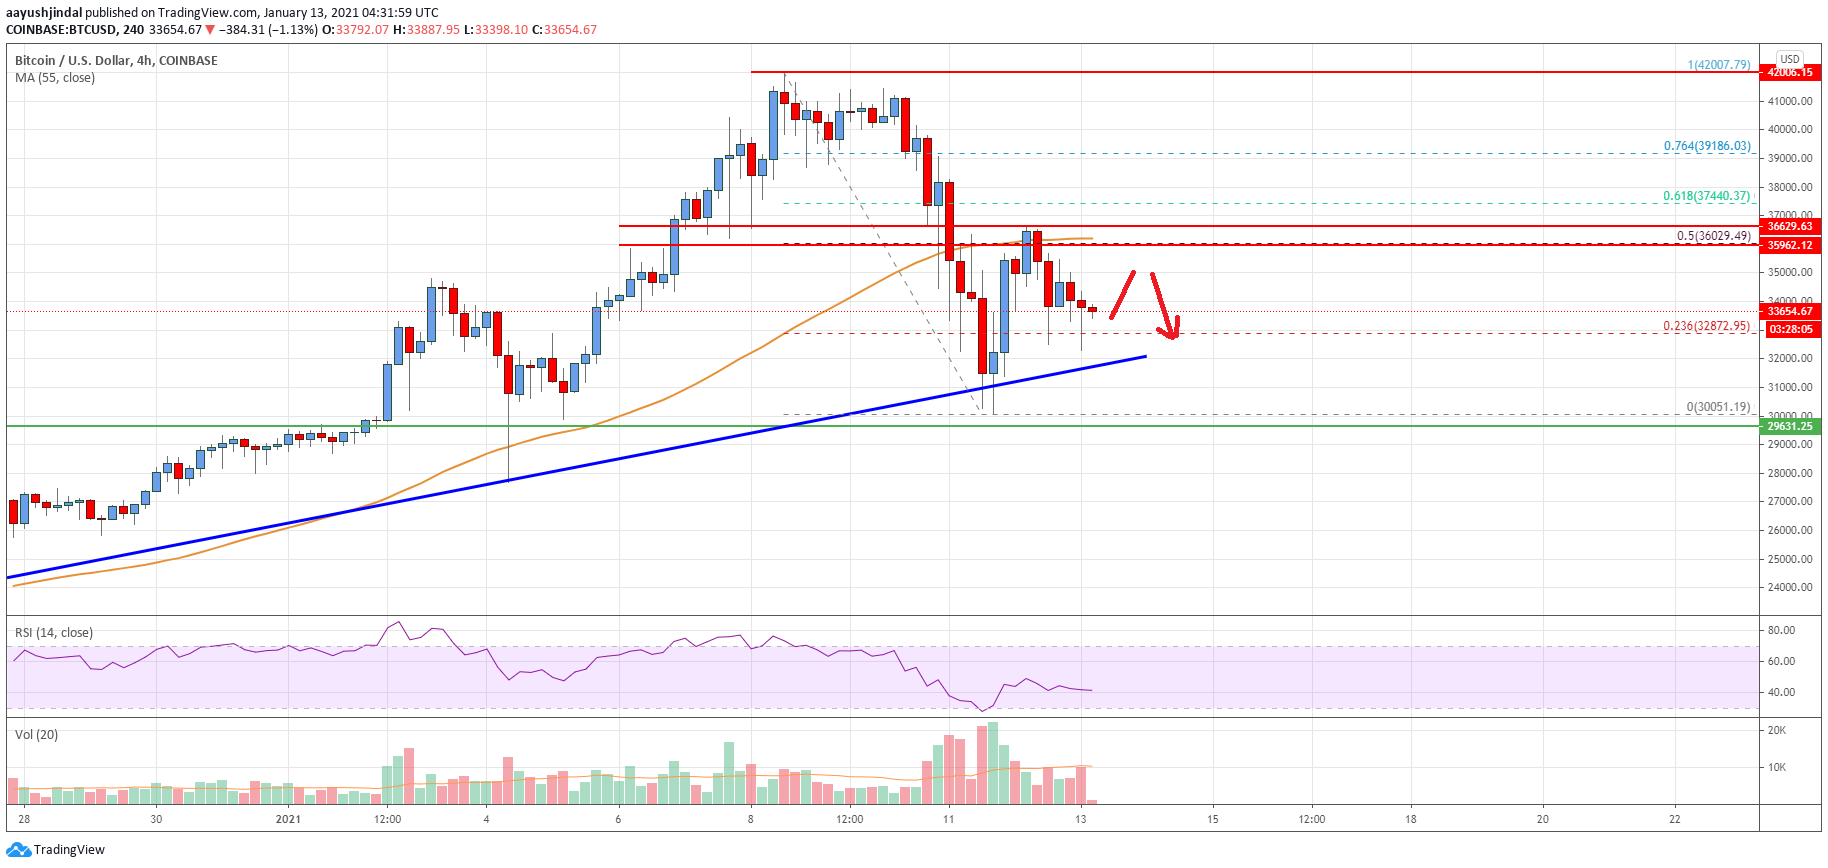
- Bitcoin price started a major downside correction from the $42,000 high against the US Dollar.
- The price is now trading well below $36,000 and the 55 simple moving average (4-hours).
- There is a key bullish trend line forming with support near $32,000 on the 4-hours chart of the BTC/USD pair (data feed from Coinbase).
- The pair must clear the $35,500 and $36,000 resistance levels to start a fresh increase.
Bitcoin price is moving lower below $35,000 against the US Dollar. BTC could start a fresh increase as long as it is above the $32,000 and $30,000 support levels.
Bitcoin Price Analysis
In the past few days, there were swing moves in bitcoin price above $35,000 against the US Dollar. BTC gained bullish momentum and broke the $38,000 resistance. It even broke the $40,000 level and the 55 simple moving average (4-hours).
A new all-time high was formed near $42,000 before the price started a sharp decline. There was a drop of over $5,000. The price broke the $36,000 and $35,000 support levels.
It traded close to the $30,000 level before starting a decent recovery. The price climbed above the $33,000 level and $34,000. There was a break above the 23.6% Fib retracement level of the recent decline from the $42,000 high to $30,000 swing low.
However, the bears defended the $36,000 resistance level and the 55 simple moving average (4-hours). The 50% Fib retracement level of the recent decline from the $42,000 high to $30,000 swing low also acted as a barrier.
The price is now moving lower, and it is now trading well below $36,000 and the 55 simple moving average (4-hours). On the downside, there is a key support forming near $32,000. There is also a key bullish trend line forming with support near $32,000 on the 4-hours chart of the BTC/USD pair.
Any more losses could lead the price towards the $30,000 support level. On the upside, the price is facing hurdles near the $35,500 and $36,000 levels. A successful break above the $35,500 level and a follow up move above the $36,000 zone is must to start a fresh surge.

Looking at the chart, bitcoin price is clearly trading well below $36,000 and the 55 simple moving average (4-hours). Overall, the price must clear the $35,500 and $36,000 resistance levels to start a fresh increase.
Technical indicators
4 hours MACD – The MACD is showing negative signs in the bearish zone.
4 hours RSI (Relative Strength Index) – The RSI is well below the 50 level.
Key Support Levels – $32,000 and $30,000.
Key Resistance Levels – $35,000, $35,500 and $36,000.


Leave a Reply
You must be logged in to post a comment.